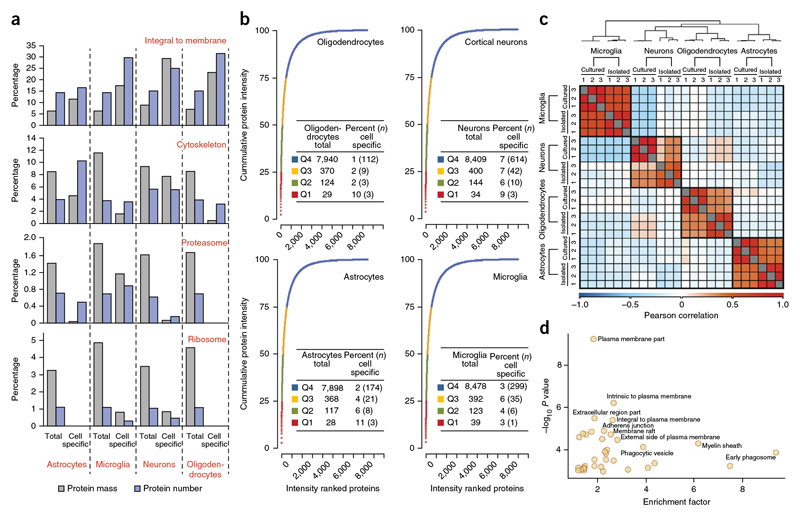
Figure 3. Quantitative analysis of expressed genes.
(a) Analysis of specific GO annotation terms (indicated in red above the bar graph) is shown as the percent of the genes corresponding to the annotation term and the percent of the protein mass that was attributed to these annotations.The analysis was performed separately for all proteins identified in indicated cell type or for those proteins that were specific to the indicated cell type. (b) Cumulative protein mass from the highest to the lowest abundance proteins for the indicated cell type. The table liststotal number of proteins constituting different quantiles (Q1-Q4) and the percent of these proteins that showed cell type-specific expression. (c,d) Comparison of acutely isolated cells with cultured cells. (c) Cells were isolated using MACS microbeads coupled with antibodies to 04 for oligodendrocytes, PSA-NCAM for neuronal progenitors, CD11b for microglia and ACSA-2 for astrocytes. The heat map shows the Pearson correlation coefficientsbetween acutely isolated and cultured cell types. The color code indicates the values of the correlation coefficients. (d) Plot of GOCC enrichment of proteins > 10-fold enriched is shown. –log10 P value is plotted against enrichment factor of the GOCC terms.

