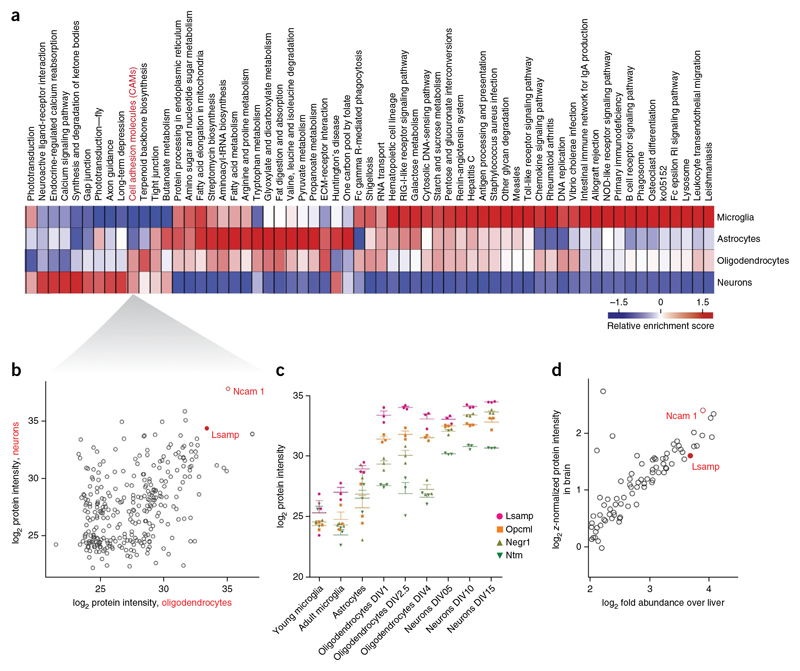
Figure 6. Comparative pathway enrichment analysis identifies cell adhesion molecules enriched In oligodendrocytes and neurons.
(a) Annotation matrix of KEGG pathways enriched in different cell types shown as a heat map (red indicating KEGG pathways higher abundance and blue indicating lower abundance) after clustering of score differences from one-dimensional annotation testing (Online Methods). (b) Scatter plot for LFQ intensities of proteins corresponding to KEGG pathway cell adhesion molecules (CAM) in oligondendrocytes versus neurons. (c) Label-free quantification of individual triplicates is shown as points with mean ± s.e.m. for the IgLON family proteins in the different CNS cells types. (d) Scatter plot of log2 fold expression versus log2 z-normalized protein intensity of proteins corresponding to KEGG pathway cell adhesion molecules in brain versus liver.

