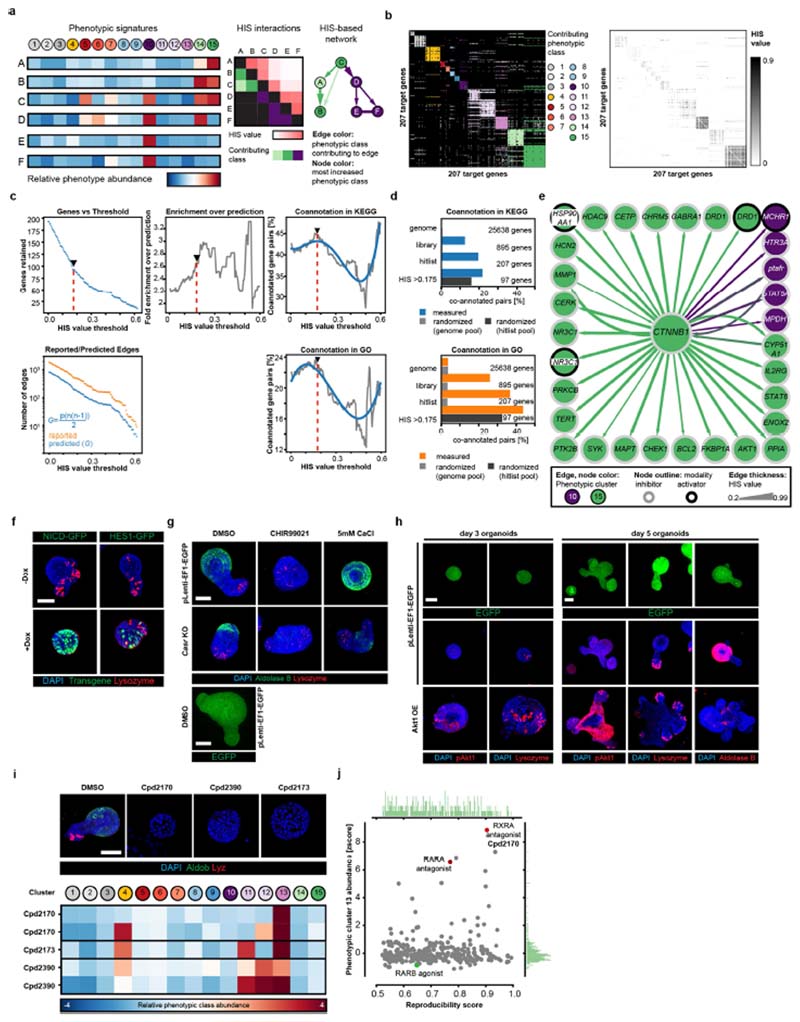
Extended Data Fig. 4. Validation of HIS predictive power and screen hits.
a, Principle of the hierarchical interaction score (HIS). HIS is calculated pairwise for a set of genes described by multivariate phenotypic signatures (left), to generate a matrix of graded interactions (middle) in which every interaction contains information on which readout contributed the most. In the resulting HIS-based network (right), the strength of the interactions (the thickness of the edges) reflects the similarity of the observed enrichment or depletion, and directionality is from the gene with the broader set of effects to the gene with the narrower set of effects. b, Heat maps of the HIS pairs for n = 207 target genes; interactions with non-zero HIS values are shown colour-coded for the phenotypic class that contributes the most to HIS inference (left) or for the HIS value (right). c, Top left, number of retained nodes; bottom left, number of STRING-reported and predicted edges (see Supplementary Methods); centre, fold enrichment of reported STRING interactions over prediction; right, percentage of co-annotated gene pairs with increasing HIS threshold cutoff (top right, KEGG co-annotations; bottom right, GO co-annotations (levels 5–15)). Red dashed line, HIS threshold (0.175); arrowheads, inflection points. Top and bottom right plots: blue line, polynomial fit. d, Percentage of coannotated gene pairs in indicated sets of genes in measured and randomized data (top, KEGG co-annotations; bottom, GO co-annotations (levels 5–15)). The corresponding number of genes is drawn either from the genome or the hitlist pool, as indicated. e, HIS-based interaction network for β-catenin. Node colour shows the highest enriched phenotypic class; edge colours show the phenotypic class contributing the most to HIS value inferences (see key); edge arrow shapes show HIS-inferred directionality. All edges directed to/from β-catenin are shown. f, Inducible NICD–GFP and HES1–GFP knock-in organoids with and without doxycycline (dox) treatment from day 0, showing loss of Paneth cells in NICD-overexpressing organoids. Nuclei are stained with DAPI (blue); lysozyme is stained with antibody (red). Scale bar, 50 μm. g, Day 5 puromycin-selected lentiCRISPRv2-mediated Casr knockout (CasrKO) organoids, with corresponding infection and selection controls (pLenti–EF1–EGFP organoids). Organoids were cultured from single cells in the indicated conditions. The upper six images show the perturbed crypt phenotype and lack of phenotypic response to CaCl2 treatment in CasrKO organoids. Bottom, lentivirally introduced EGFP expression after puromycin selection. Scale bars, 30 μm. h, Top two rows, day 3 and day 5 puromycin-selected control (pLenti–EF1–EGFP) organoids; bottom row, lentiviral Akt1-overexpressing (Akt1 OE) organoids cultured from single cells, showing perturbed phenotypes and lack of enterocyte differentiation. Scale bars, 30 μm. i, Top, organoids from DMSO control and RXR antagonist conditions analysed in the screen. Scale bar, 50 μm. Bottom, corresponding phenotypic signatures. n = 2, 2 and 1 non-sparse (n > 10 organoids) independent replica for Cpd2170, Cpd2390 and Cpd2173, respectively. j, Abundance of phenotypic cluster 13 in hit conditions with a reproducibility of more than 0.5. Compounds targeting RXR and RAR are depicted with coloured dots. Histograms show distributions of respective values. n = 301 independent conditions. Microscopy images shown in f-i are MIPs of confocal z-stacks. f-h, Assays performed in n = 12 independent replica from 2 independent organoid cultures with similar results.

