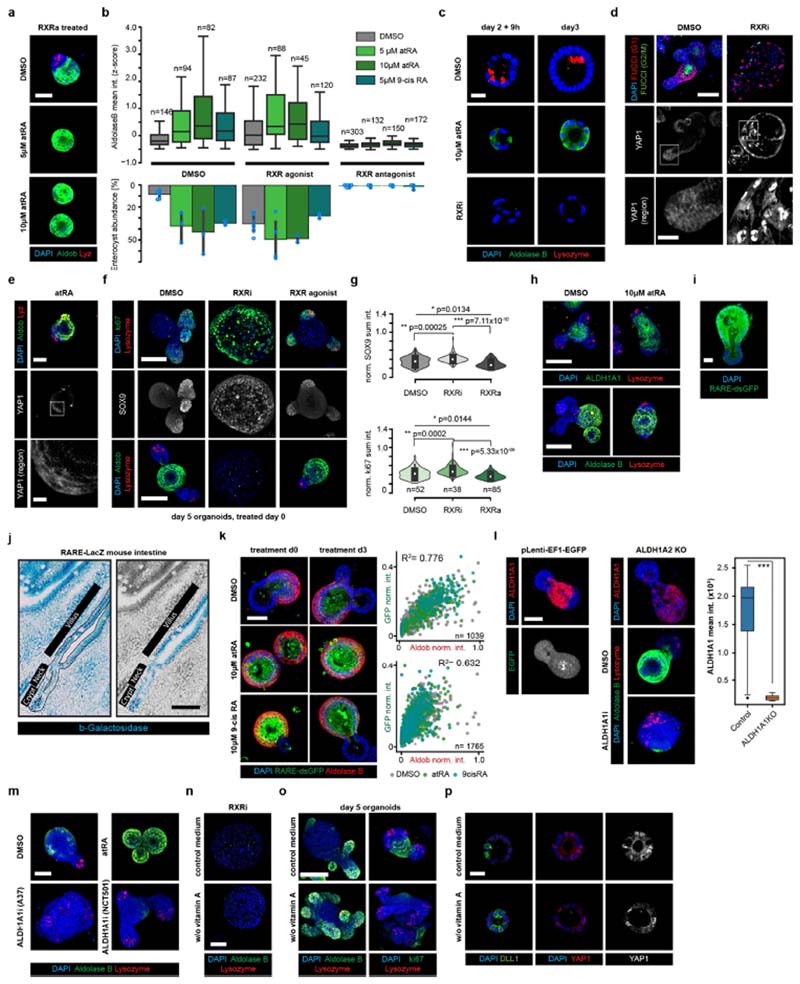
Extended Data Fig. 5. Profiling the effects of treatment with an RXR antagonist.
a, Images of organoids cultured in the presence of an RXR agonist (RXRa) in the indicated treatment conditions. Scale bar, 50 μm. Assay performed in n = 12 (DMSO) or n = 6 (other conditions) independent replica from 2 independent organoid cultures. b, Top, distribution of mean aldolase B staining intensity in control organoids and those treated at day 4. Bottom, abundance of the ‘enterocyst’ phenotype in the indicated conditions. Error bars show standard deviations between n = 6 (DMSO) or n = 3 (other conditions) independent replica. Assays were performed with the same number of replicas from two independent organoid cultures with similar results. c, Images of organoids fixed at indicated time points, showing antibody staining for lysozyme. Scale bar, 20 μm. d, Top two rows, images of organoids from Fucci2 mice, expressing a dual-colour cell-cycle reporter (mVenus-hGem(1/110), G2/M-phase reporter; mCherry–hCdt1(30/120), G1-phase reporter) cultured with or without RXR antagonist (RXRi), fixed at day 4. Top row, expression of mVenus–hGem(1/110) (FUCCI (G2/M)), mCherry–hCdt1(30/120)(FUCCI (G1)); bottom row, antibody staining for YAP1. Scale bar, 100 μm. Bottom row, enlargements of those areas outlined in the middle row. Scale bar, 20 μm. e, Images of organoids following 10 μM atRA treatment at day 3. Top row, scale bar, 50 μm. Bottom row, scale bar, 10 μm. f, Organoids fixed at day 5, 48 h after switch to ENR medium. Scale bar, 100 μm. g, Top, distribution of mean SOX9, and bottom, ki67 staining intensity in control and treated organoids. Organoids were fixed at day 5, 48 h after switching to ENR medium. Violin ranges extended by one standard deviation. Two-sided t-test; P-values shown in the plot. h, Images of wild-type organoids, treated as indicated at day 3, and fixed at day 5. Scale bar, 100 μm. i, Images of organoids expressing RARE–dsGFP at day 4. dsGFP, destabilized GFP; scale bar, 10 μm. Assay performed in n = 12 independent replicates from n = 3 independent organoid cultures with similar results. j, Histological images of mouse small intestinal epithelium from RARE-LacZ mouse. Regions along the crypt–villus axis are indicated. A single crypt flanked by villus regions, outlined in the left panel, is shown in blue at the right. Scale bar, 50 μm. Experiment performed in n = 4 independent histological samples from n = 2 independent mice with similar results. k, Left, RARE–dsGFP organoids in the indicated treatment conditions. Scale bar, 60 μm. Right, DAPI-normalized sum intensity (norm. int.) of RARE–dsGFP reporter and aldolase B in individual organoids. Data points represent individual organoids, colour-coded according to treatment as indicated. R 2, Pearson’s correlation coefficient. l, Left, puromycin-selected ALDH1A2- knockout organoids. Scale bar, 50 μm. Right, ALDH1A1 staining intensity in control and ALDH1A1-knockout organoids. n = 36 and 17 organoids for control and ALDH1A1-knockout conditions respectively. ***P = 5 x 10-18, two-tailed t-test. m, Images of organoids treated as indicated from day 0. ALDH1A1i, 5 μM ALDH1A1 inhibitor; atRA, 10 μM all-trans retinoic acid. Scale bar, 50 μm. Assay performed in n = 8 independent replica. n, Images of organoids treated with RXR antagonist from day 0 in medium with or without vitamin A. Organoids were fixed at day 5, 48 h after switch to ENR medium. Scale bar, 50 μm. o, Wild-type organoids cultured in medium with or without vitamin A. Scale bar, 100 μm. p, Organoids cultured in medium with or without vitamin A and fixed at the indicated time points. Scale bar, 20 μm. a, d–f, h, k–o, Microscopy images are composite MIPs of confocal z-stacks. c, i, p, Microscopy images are composite individual z-planes from the organoid middle plane. b, g, k, n indicates the number of individual organoids used as data points. b, l, Boxes show quartile ranges; whiskers show value intervals with excluded outliers; middle lines or white dots show median values. c–f, h, Assays performed in at least four independent replicates from at least two independent organoid cultures with similar results. a, c–f, h, i, k–p, Organoids were cultured in the indicated conditions from single cells.

