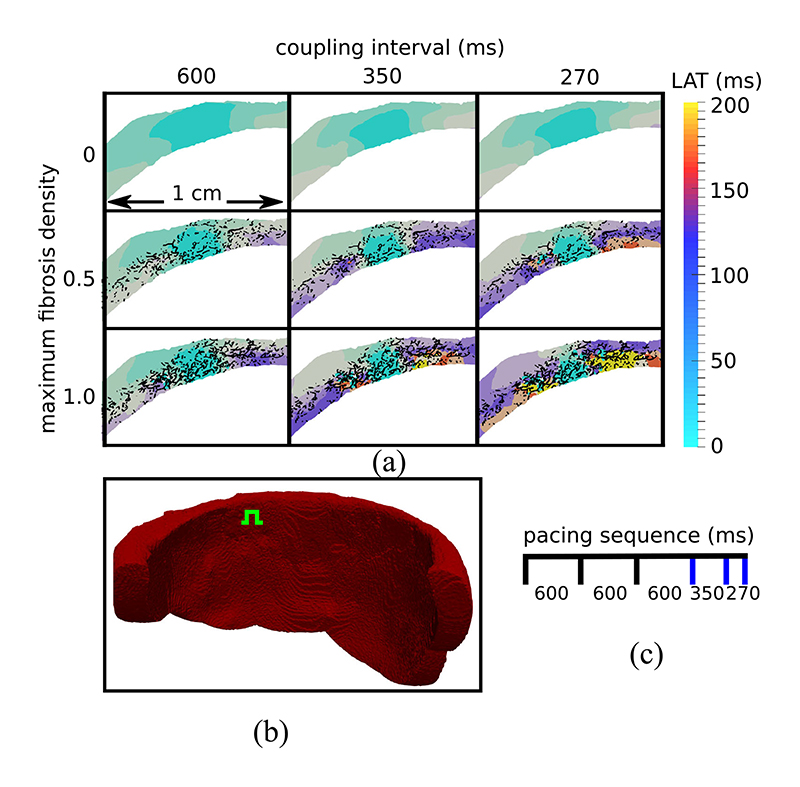
Fig. 6.
(a) Local activation time (LAT) maps in a transmural tissue slice around the stimulus location. Activation delays are larger with increased fibrosis and decreased coupling interval (Cl). The black lines represent the projection of the 3D split face network onto the LAT map plane. White areas are electrically isolated elements which were removed during preprocessing. (b) Endocardial view of the tissue geometry with the green symbol showing the location of the stimulus site. (c) Timing of stimuli with blue lines indicating stimuli whose activation maps are displayed.

