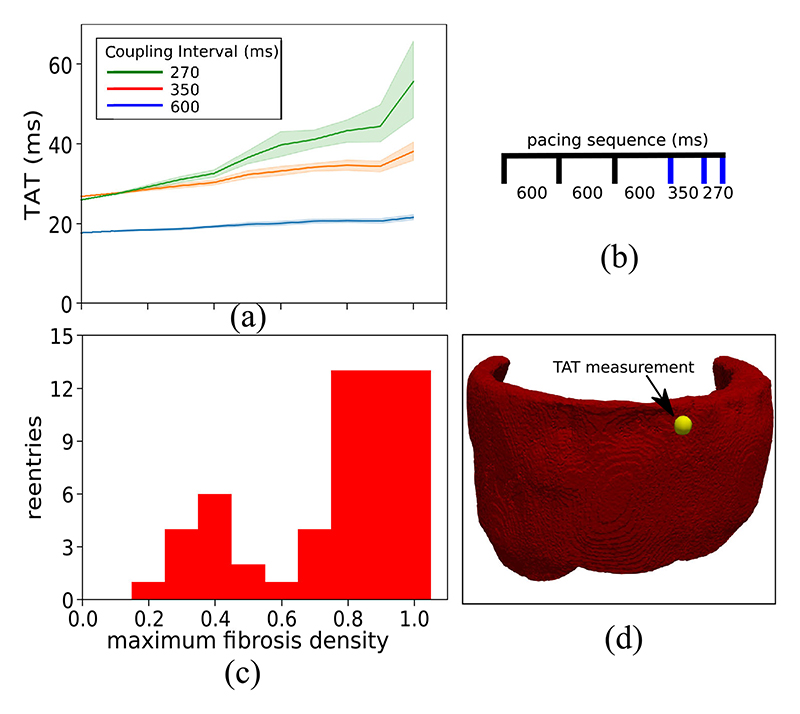
Fig. 7.
The relationship between transmural activation times (TAT) and reentries inducible by simulated programmed electrical stimulation. (a) The mean and 95% confidence region of the TAT values from 15 random fibrosis networks for each level of maximum fibrosis density. (b) Timing of stimuli used to calculate TAT scores. The blue lines indicate stimuli for which TAT was measured. (c) The number of random fibrosis networks for which reentry could be simulated at each density level. (d) Epicardial view of the ventricular geometry with TAT measurement location (yellow sphere).

