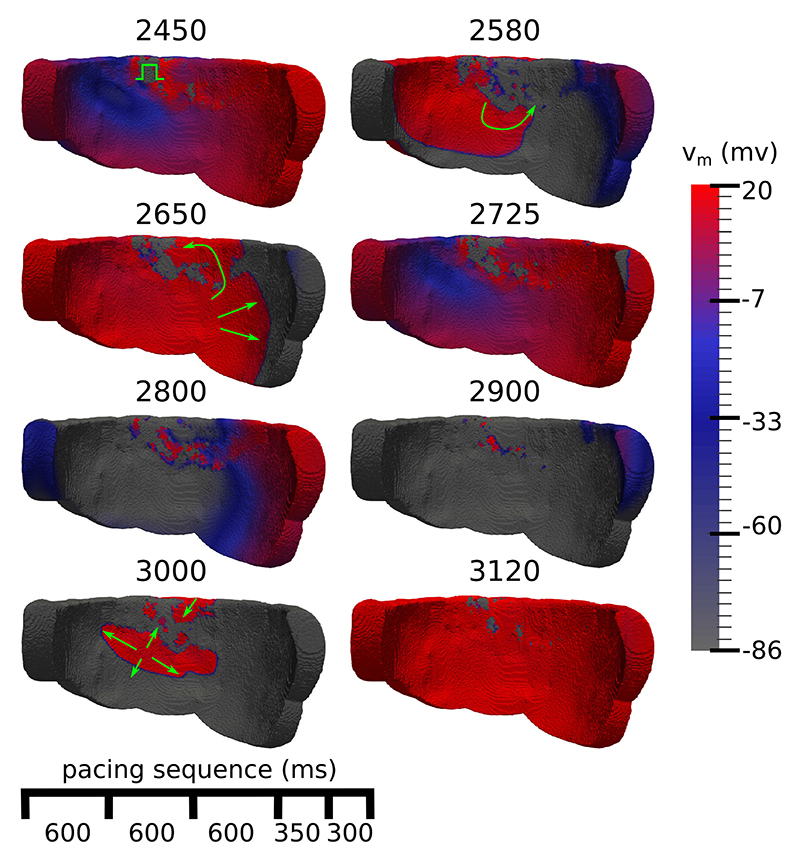
Fig. 8.
Endocardial view of transmembrane voltage (vm) maps after an extrastimulus that triggers an electrical reentry. The numbers at the top of each voltage map are the simulation time in ms, green arrows highlight directions of activation. 2450) The extrastimulus (green symbol) arrives into a heterogeneous repolarization landscape created by the previous stimuli. 2580, 2650) The extrastimulus spreads unevenly, first activating the tissue to the left and then later to the right. 2725, 2800) Most of the tissue repolarises. 2900) Islands of activated tissue remain in the fibrotic areas. 3000) Reentrant wavefronts emerge out of the fibrosis. 3120) Most of the tissue has been reactivated due to the reentry.

