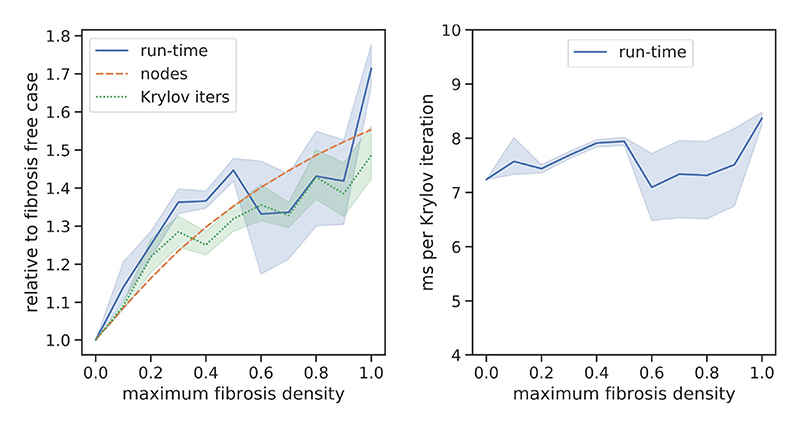
Fig. 9.
Number of mesh nodes, run-time, and Krylov iterations used to calculate the solution of the transmural activation simulations in Section III-B. The lines represent the mean over 15 simulations, whereas the shaded areas represent the 95% confidence region. Measurements in the left panel are relative to the control case, whereas the right panel shows the number of ms run-time per Krylov iteration.

