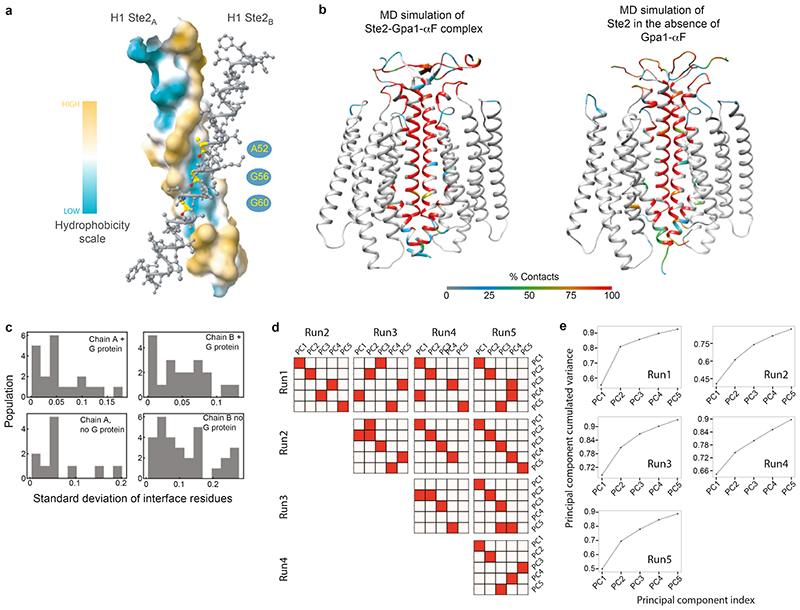
Extended Data Fig. 8. MD simulations of the Ste2 dimer in the absence of G proteins and ligands.
a, Groove in the H1-H1 dimer interface. b, Heat map of the percentage of MD snapshots that show residue contacts in the dimer interface in the EM structure and in the representative structure from MD simulations in the absence of the ligands and G proteins. c, Top row, histograms of the standard deviation among 25 simulation runs (total 1.4 μs) for Ste2 dimer with G protein and α factor. Bottom row, histograms of the standard deviation in Ste2A and Ste2B interface residue contacts among 5 simulation runs (total 5 μs) of the Ste2 dimer without G protein. d, Convergence of the five 1 μs simulations was tested by calculating dot product among the top 5 weighted principal components (PC) for the 5 simulations of Ste2 dimer without G protein or α factor. The top weighted principal components PC1 to PC5 from each run all show strong overlap (red squares) with at least one of the PCs from other runs. e, Cumulative variance of PCs show that the top five PCs occupy more than 90% of the populations and therefore they are sufficient to describe the motion of the complex.

