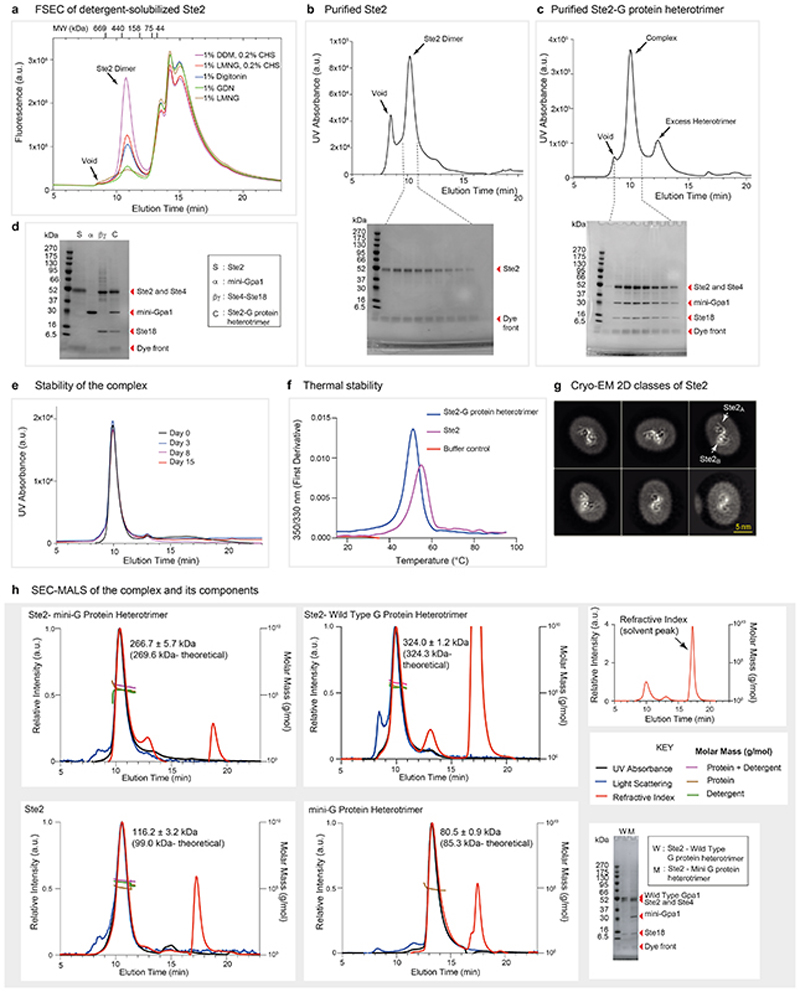
Extended Data Fig. 1. Purification, formation, and biophysical characterization of the Ste2-G protein heterotrimer complex.
a, FSEC trace of insect cells expressing wtSte2-TEV-eGFP-His10 solubilised in different detergents. Ste2 migrated as a dimer in all tested detergents with an apparent molecular weight of ~380 kDa. The molecular weight standards used for calibration of the column are shown for reference. Results are representative of three independent experiments. b, Size-exclusion chromatography (SEC) profiles of Ste2 and SDS-PAGE analysis of the eluted fractions. c, SEC profiles of Ste2-G protein heterotrimer complex and SDS-PAGE analysis of the eluted fractions from the complex formation reaction (see methods). d, SDS-PAGE analysis of the pooled and concentrated Ste2-G protein complex along with the individual components used to form the complex. Experiments in b, c, and d are representative of three independent purifications. e, Complex stability as analysed by SEC after incubation of the purified complex on ice for up to 15 days. This experiment was carried out once. f, Thermal stability as analysed by nanoDSF, which measures changes in the intrinsic fluorescence of the protein when subjected to thermal denaturation. The melting temperatures (Tm) of Ste2-G protein complex and Ste2 dimer were calculated to be 51.2 °C and 55.0 °C, respectively. This experiment was performed once in two replicates. g, Representative 2D class averages of Ste2 imaged on a Titan Krios with the GIF Quantum K2 detector and a Volta Phase Plate56 (VPP). All classes are consistent with a dimer and no monomer classes were observed. h, SEC-MALS analysis of the Ste2-mini-G protein heterotrimer complex, Ste2-wild type G protein heterotrimer complex, Ste2 dimer and mini-G protein heterotrimer complex. A large change in refractive index that occurs at the end of column volume due to the elution of salts and/or detergents present in the solvent is indicated as solvent peak. Where indicated, chromatograms show signal from UV absorbance, light scattering and refractive index. The traces were normalized to the peak maxima. Calculated molar masses are depicted as traces. The molar masses of the protein components across the peak and the theoretical molar masses are indicated. SDS-PAGE analysis of the Ste2-mini-G protein heterotrimer and Ste2-wild type G protein heterotrimer complexes are shown. The results are representative of three independent experiments, except the experiment with Ste2 dimer, which was performed once. For gel source data (panels b, c, d and h), see Supplementary Figure 1

