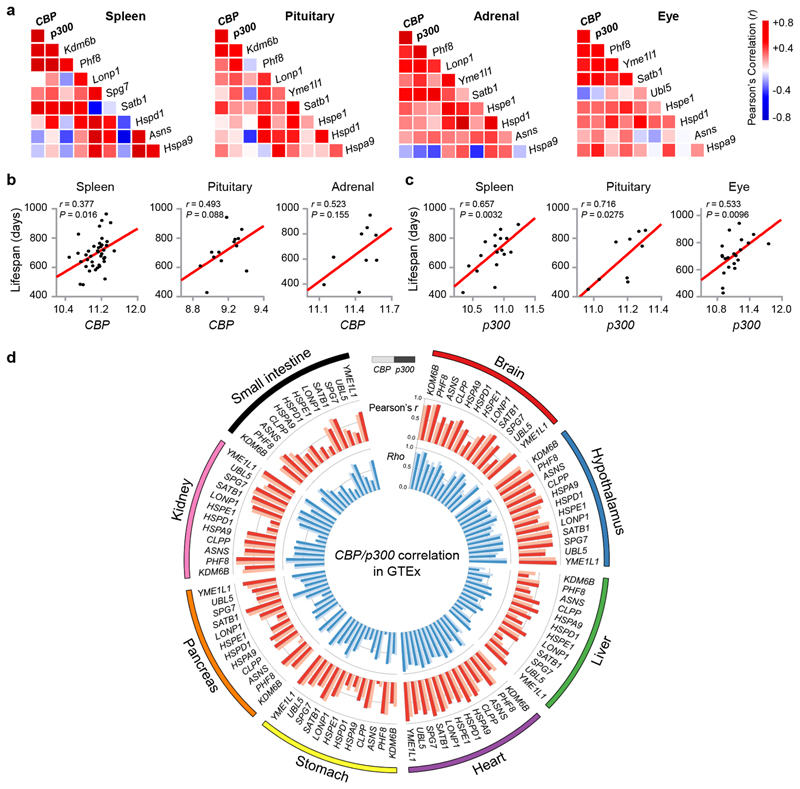
Fig. 5. Expression of CBP/p300 positively correlates with UPRmt transcripts and longevity in mouse and human populations.
a, Pearson’s correlation co-expression heat-map for CBP, p300, Kdm6b, Phf8 and UPRmt genes in spleen, pituitary, adrenal and eye of the BXD mouse genetic reference population43, 52. Positive and negative correlations are indicated in red and blue, respectively. The intensity of the colors corresponds to correlation coefficients. b, Positive correlations between lifespan and CBP transcript levels in spleen, pituitary and adrenal of BXD mice (Pearson’s r, two-sided). c, Positive correlations between lifespan and p300 transcript levels in spleen, pituitary and eye of BXD mice (Pearson’s r, two-sided). d, Circos plot of the expression correlations between CBP/p300 transcripts and the UPRmt gene transcripts in the brain (cerebellar hemisphere), hypothalamus, liver, heart (left ventricle), stomach, pancreas, kidney and small intestine of human samples derived from the Genotype-Tissue Expression (GTEx) database (v8)54. Red bar ring: the Pearson’s correlation coefficients (r) between UPRmt gene transcripts and CBP (light red) or p300 (dark red). Blue bar ring: the Spearman Rank correlation coefficients (Rho) between UPRmt gene transcripts and CBP (light blue) or p300 (dark blue). All correlations were found to be positive.

