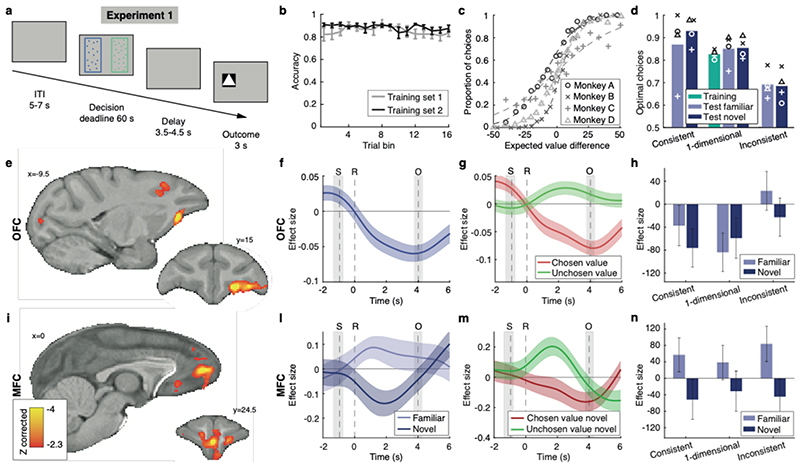
Fig. 2. Experiment 1, neural correlates of familiar and novel decisions.
(a) Trial timeline. (b) Proportion of correct responses during training. Error bars represent standard error of the mean (SEM). (c) Test performance (probability of choosing right as a function of right minus left expected value). (d) Comparison of performance across training and testing conditions. Optimal choices maximise expected value. Bars represent mean of four subjects. (e) Value comparison signal, i.e. chosen value minus unchosen value, across all trials, whole-brain cluster-corrected. (f) Time-course of the parametric modulation of the BOLD signal in OFC for all trials, time-locked to response. S: stimulus, R: response, O: outcome. Coloured line: mean of all sessions; coloured shade: SEM across sessions. Grey shades: interquartile ranges of stimulus and outcome time distributions. Same conventions apply in panels g,l,m. (g) Value comparison signal in OFC split into its components. (h) Value comparison signal in OFC split by condition. Error bars represent SEM. (i) Comparison signal difference between novel and familiar conditions, whole-brain cluster-corrected. Scale bar applies to both panels e and i. (l) Parametric modulation of the BOLD signal in MFC for novel and familiar choices separately. (m) Chosen value and unchosen value contributions to the comparison signal in MFC for novel trials only. (n) Value comparison signal in MFC split by condition. Same conventions as panel h. In all panels n=4 monkeys x n=12 sessions.

