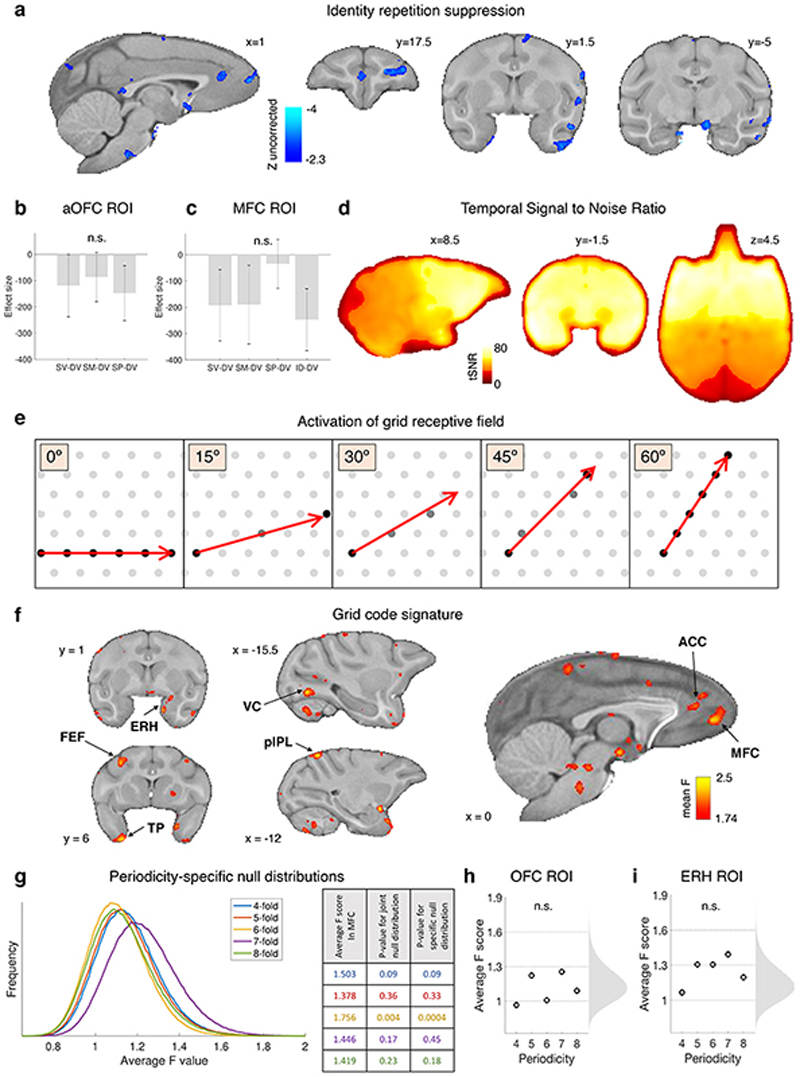
Extended Data Fig. 4. Additional fMRI results of experiment 2.
(a) Using whole-brain FWE cluster correction, no significant repetition suppression effects were found elsewhere in the brain. However, for the sake of completeness, we illustrate here the distribution of uncorrected effects throughout the brain indicating the locations of potential representations of specific identities of stimuli; contrast of BOLD activity elicited by stimuli preceded by identical stimuli vs stimuli preceded by different stimuli (ID-DV, GLM3). Outside the prefrontal mask (Extended Data Fig.9d), repetition suppression effects analogous with those reported in the main text for anterior OFC (Fig.3e), were observed in the anterior temporal lobe / perirhinal cortex, in entorhinal cortex and the perigenual ACC, in the principal sulcus and in medial frontal pole (Z > 2.3, uncorrected). (b) After Bonferroni correction (all t 11 < 1.42, all adjusted P > 0.28) there were no significant repetition suppression effects in aOFC when successive stimuli had the same value but different probability and magnitude components (SV) compared to successive stimuli with different values (DV), nor when successive stimuli sharing just the same magnitude component (SM) or the same probability component (SP) were compared to DV stimuli. Error bars represent standard error of the mean (SEM) in this panel and the next. As in main Fig.3e, this test is restricted to sessions 3-5 of experiment 2. (c) No significant effect of repetition suppression was observed in MFC (ROI identified in experiment 1) after Bonferroni correction (all t 11 < 2.1, all adjusted P > 0.09) for the same contrasts as shown in panel b, plus the effect of identical stimuli versus different stimuli (ID-DV). (d) Temporal signal to noise ratio; the tSNR was very good in the anterior part of brain, but slightly lower at the edges, which may potentially explain the weak grid effect in entorhinal cortex. (e) Illustration of the relationship between trajectory angle and response of grid cells. In grey, schema of the receptive field of an ideal grid cell (multiple neighbouring cells tend to align with each other). In red, trajectory from one location to the next one in a two-dimensional space. The amount of activation of the cell’s receptive field varies continuously with the trajectory angle and repeats itself every 60°. In this example, it is maximum at 0° and 60° and minimum at 30°, but in the general case the orientation of the grid is not known a priori. (f) Additional sections of the whole-brain distribution of quadrature test scores for a hexagonal grid code, also reported in main Fig.3f, averaged across 20 sessions and thresholded at F > 1.74 (P < 0.001 uncorrected). Consistent with previous results in humans, we observed a six-fold modulation of the BOLD signal in entorhinal cortex (ERH), visual cortex (VC), anterior cingulate cortex (ACC), frontal eye field (FEF), temporal pole (TP), and posterior intraparietal lobule pIPL. These results are presented without cluster correction (because of the non-normal distribution of the F statistics, standard cluster correction could not be performed). (g) Separate null distributions for each periodicity. Each distribution is based on all sessions and locations within the brain, for a given GLM. Non-parametric tests of each periodicity based on these distributions gave the same results as those based on the joint distribution. P-values are reported in the table. (h-i) Statistical results from the grid code test at different periodicities. No significant effect after Bonferroni correction in OFC (h), nor entorhinal cortex (ERH) (i). The results reported in panel i refer to right ERH; they were qualitatively the same as those from left ERH. The shuffled null distribution is shown to the right and the F values indexing grid effects for each periodicity are shown to the left in each panel. None of the periodicities reached significance in either region, even if some voxels in entorhinal cortex exceeded the P < 0.001 threshold for the 6-fold symmetry, as reported in panel f.

