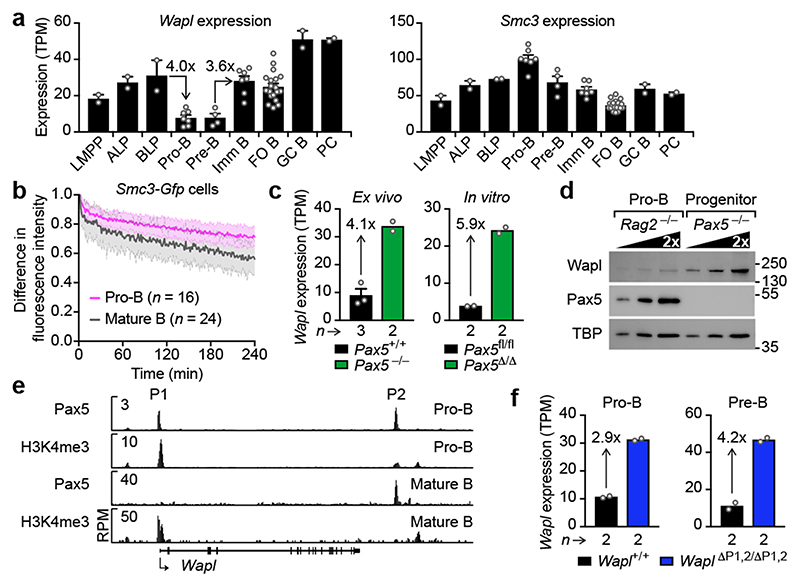
Fig. 2. Pax5-dependent repression of Wapl in pro-B and pre-B-cells.
a, Expression of Wapl and Smc3 in developing B-cells. RNA-seq expression data for the indicated cell types (Methods) are shown as mean TPM values with SEM. LMPP, lymphoid-primed multipotent progenitors; ALP, all-lymphoid progenitors; BLP, B-cell-biased lymphoid progenitors; FO and GC B, follicular and germinal centre B-cells; PC, plasma cells. For experiment numbers see source data. b, iFRAP analysis of short-term cultured bone marrow pro-B-cells and ex vivo sorted splenic mature B-cells from Smc3-Gfp transgenic mice. The difference in fluorescence intensity between bleached and unbleached regions is plotted against time. The mean values are indicated by lines and the SD by shading. n, number of cells analysed. c, Wapl expression in ex vivo sorted and in vitro cultured pro-B-cells of the indicated genotypes. d, Wapl expression in cultured Pax5 –/– progenitors and Rag2 –/– pro-B-cells, determined by immunoblotting of whole-cell extracts with antibodies detecting Wapl, Pax5 or TBP. One of two experiments is shown with marker proteins (kilodaltons). e, Detection of Pax5 binding and H3K4me3 at the Wapl locus in bone marrow pro-B-cells and splenic mature B-cells by ChIP-seq. The Pax5 peaks P1 and P2 are indicated. One of two experiments is shown. f, Wapl expression in pro-B and pre-B-cells of Wapl ΔP1,2/ΔP1,2 and Wapl +/+ mice is shown as mean TPM values. n, number of RNA-seq experiments (c,f).

