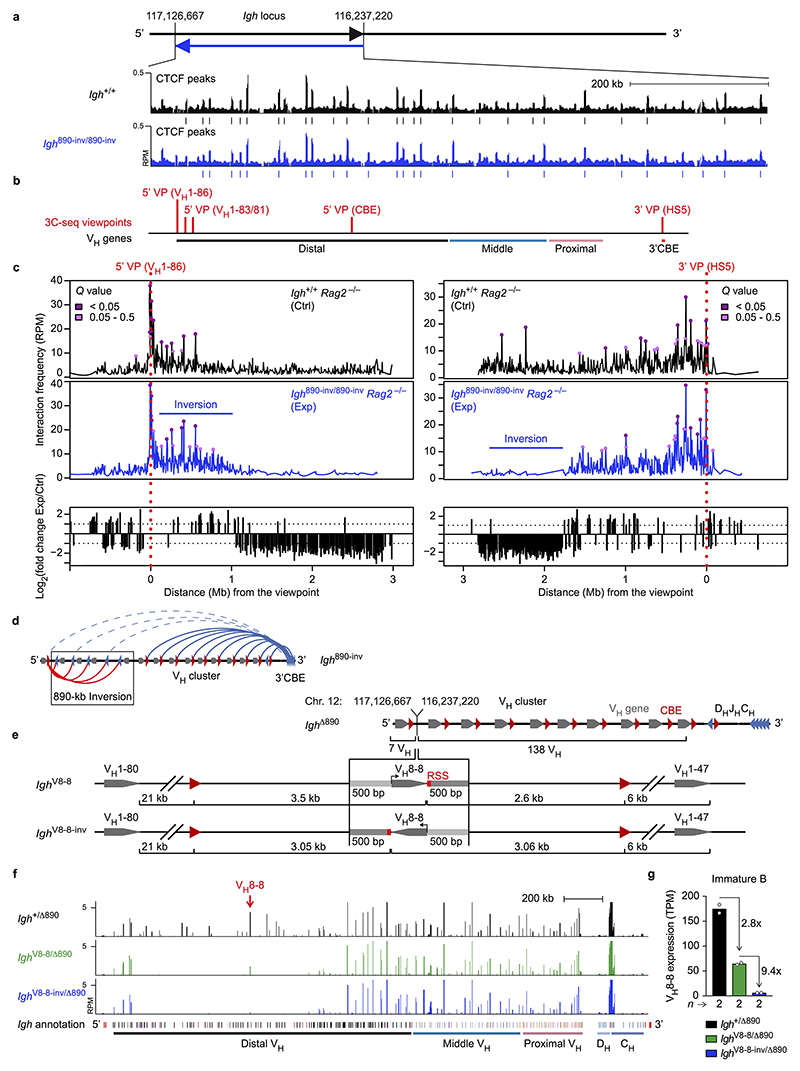
Extended Data Fig. 2. Dependence of VH-DJH recombination on chromatin looping and VH gene orientation.
a, ChIP-seq analysis of CTCF binding in the distal 890-kb region in short-term cultured pro-B cells from Igh 890-inv/890-inv and Igh +/+ mice. Vertical bars indicated CTCF peaks defined by ‘peak calling’. The ChIP-seq data of the Igh 890-inv allele were aligned on the wild-type Igh sequences. One of two experiments per genotype is shown. b, Igh positions of the 3C-seq viewpoints, which are referred to by the nearest VH gene, the hypersensitive site 5 (HS5) in the 3’CBE region or the CBE array insertion (Supplementary Table 1c). c, Interactions from the 5’ (VH1-86; left) and 3’ (HS5; right) viewpoints in short-term cultured pro-B cells from Igh 890-inv/890-inv Rag2 –/– and Igh +/+ Rag2 –/– mice. The 3C-seq reads along the Igh locus (upper two panels) are shown as RPM values with the respective Q values, which were calculated by the r3Cseq program based on two 3C-seq experiments per genotype. The lower panel shows the fold-change of the RPM values for interaction differences of > 2-fold (dashed line) between experimental (Exp) Igh 890-inv/890-inv Rag2 –/– and control (Ctrl) Igh +/+ Rag2 –/– pro-B cells. d, Schematic diagram summarising the loop formation at the Igh 890-inv allele in pro-B cells. The CBEs with their orientation are indicated by red and blue arrowheads, VH genes by grey arrows and loops by arches. The new loop domain is indicated in red. e, Schematic diagram of the Igh Δ890, Igh V8-8 and Igh V8-8-inv alleles. The Igh V8-8 and Igh V8-8-inv alleles were generated by insertion of the VH8-8 gene with 500 bp of its 5’ and 3’ flanking sequences (lacking any CBE) in the forward or reverse orientation at the deletion point (117,126,667 / 116,237,220; mm9, Chr. 12) of the Igh Δ890 allele (see Methods). The distances from the 3’ end of the VH8-8 gene to the next CBEs and VH genes are indicated. The sequence of the inserted VH8-8 with its flanking DNA sequences is shown in Supplementary Table 1b. f, RNA-seq profile of the Igh locus in immature B cells from the bone marrow of Igh V8-8/Δ890, Igh V8-8-inv/Δ890 and Igh +/Δ890 mice. The VH8-8 gene position and Igh annotation are indicated. The data of one of two RNA-seq experiments per genotype is shown. g, VH8-8 mRNA expression in immature B-cells of the indicated genotypes is shown as mean TPM (transcripts per million) value. Each dot corresponds to one experiment.

