
Fig. 7.
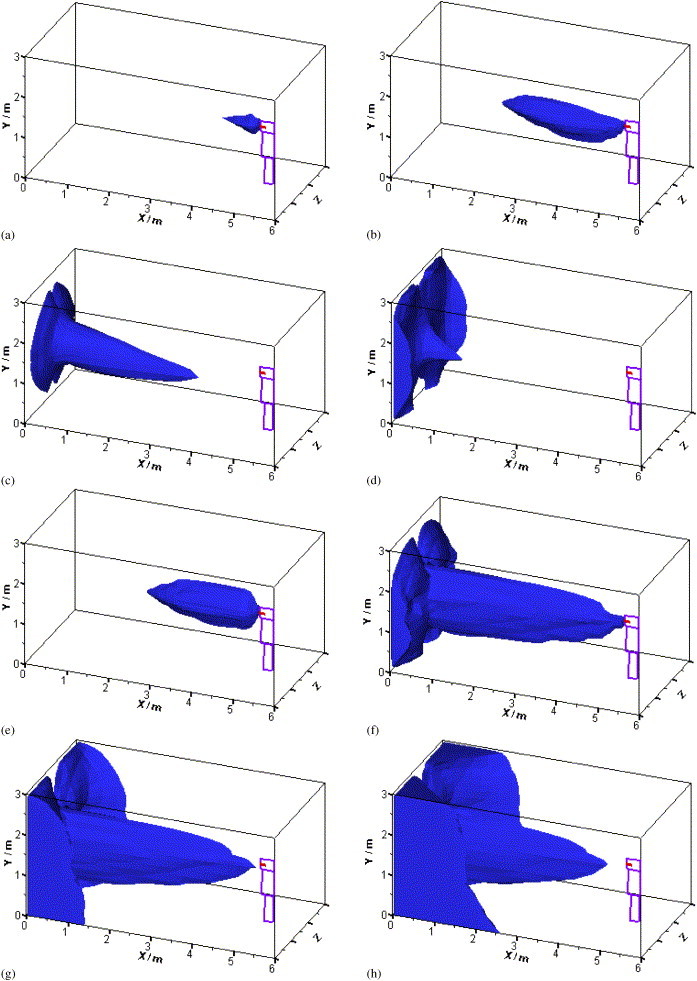
3-D view of the particle concentration at different times when sneezing or coughing (a–d: Vem=20 m/s, e–h: Vem=100 m/s): (a) t=0.05 s, (b) t=0.5 s, (c) t=5 s, (d) t=10 s, (e) t=0.05 s, (f) t=0.5 s, (g) t=0.6 s, (h) t=1 s.
Official websites use .gov
A
.gov website belongs to an official
government organization in the United States.
Secure .gov websites use HTTPS
A lock (
) or https:// means you've safely
connected to the .gov website. Share sensitive
information only on official, secure websites.
3-D view of the particle concentration at different times when sneezing or coughing (a–d: Vem=20 m/s, e–h: Vem=100 m/s): (a) t=0.05 s, (b) t=0.5 s, (c) t=5 s, (d) t=10 s, (e) t=0.05 s, (f) t=0.5 s, (g) t=0.6 s, (h) t=1 s.