
Fig. 4.
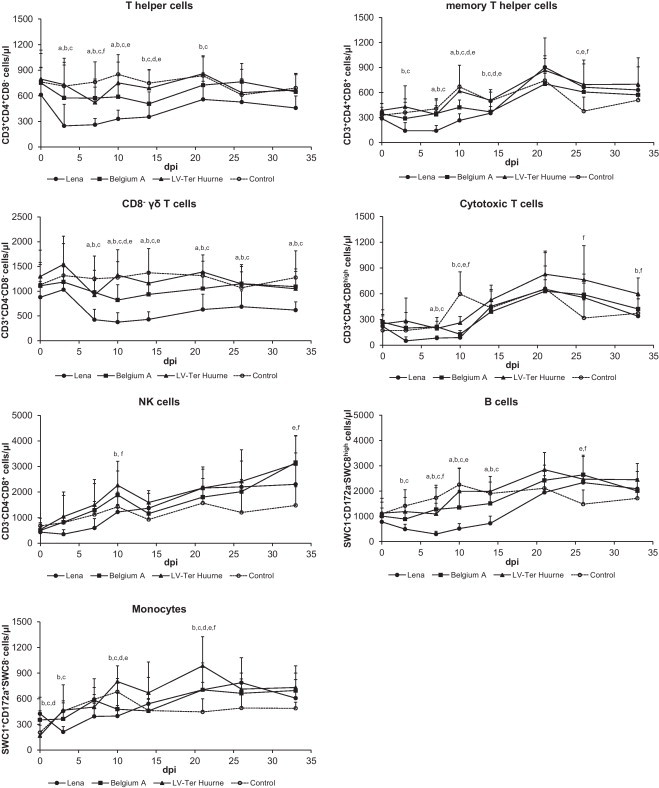
Frequency of immune cells in blood of pigs infected with different PRRSV strains. Each data point represents the average of seven or eight pigs ±S.D. “a” denotes a significant difference (p < 0.05) between Lena and Belgium A-infected pigs; “b” between Lena and LV-infected pigs; “c” between Lena and control pigs; “d” between Belgium A and LV-infected pigs; “e” between Belgium A and control pigs; and “f” between LV and control pigs.