
Fig. 5.
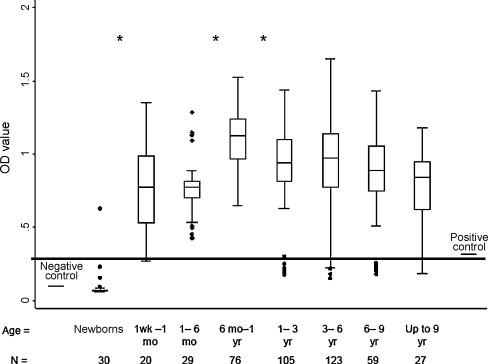
Seroprevalence against bovine noroviruses in the Belgian cattle. The OD means of the different age groups of animals, collected in the ELISA format (unequal variance and non-normal distribution), were compared with the Wilcoxon rank-sum test. The distribution of the optical densities obtained with the indirect ELISA is represented in a box plot format where optical densities are reported in function of age classes. An asterisk highlights significant statistical differences between means of the different age groups. The cut-off is represented by the line at 0.3 and the dots represent extreme values. OD: optical density, negative control: optical density value obtained for the bovine negative serum (anti-rabbit IgG), positive control: optical density value obtained for the positive control (calf experimentally infected with the Newbury2 strain, Bridger et al., 1984), mo: month, wk: week, yr: year.