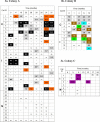
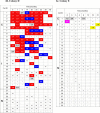
Table 3.
(a–e) FCV viral shedding and strain patterns of individual cats within each of the five colonies
 |
 |
In each colony cats are broadly divided into three groups, consistent shedders (C) positive on ≥75% occasions; intermittent shedders (I) positive on <75% occasions; non-shedders (N) never positive for FCV. For all colonies coloured squares represent FCV isolated, viral strain identified and viral titre (expressed as log10 TCID50 per 0.1 ml sample); empty square (□) represents no FCV isolated; grey square ( ) represents FCV isolated but no strain information available; grey square (
 ) represents mixed FCV infection with two distinct viral strains; ns indicates that cat was not sampled; * Indicates cat was not part of the colony at the time of sampling; na represents cat was FCV positive but viral titre was not available; aFeHV-1 isolated. For individual colonies: (3a) Colony A, black square (
 ) is strain A1 and orange square (
 ) is strain A2; (3b) Colony B, brown square (
 ) is strain B1, green square (
 ) is strain B2, and blue square (
 ) is strain B3; (3c) Colony C, purple square (
 ) is strain C1; (3d) Colony D, red square (
 ) is strain D1, and blue square (
 ) is strain D2, recombinant virus is cat 24; (3e) Colony E, pink square (
 ) is strain E1 and yellow square (
 ) is strain E2.
