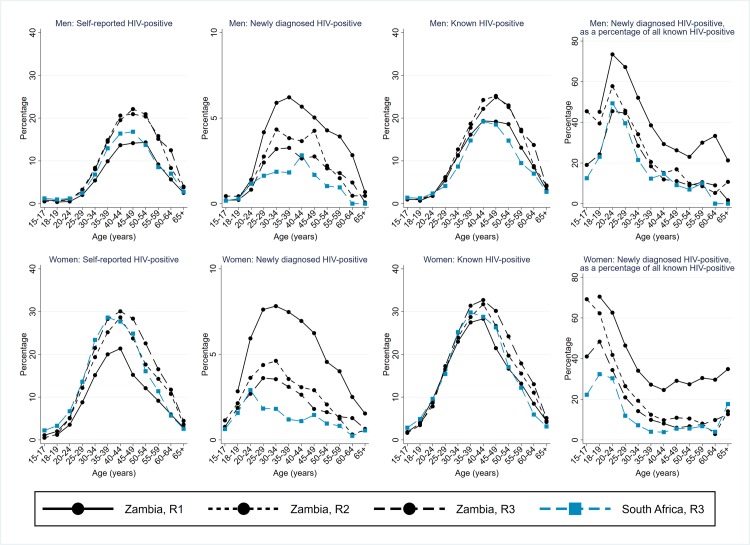
Fig 4. Arm A: Self-report of HIV-positive status, new HIV-positive diagnosis, and total known to be HIV positive, as a percentage of individuals who participated in the intervention; and the percentage of known HIV-positive individuals who were newly diagnosed HIV positive.
Zambian communities R1–R3 and SA communities R3, by sex and age group. R1, Round 1; R2, Round 2; R3, Round 3; SA, South Africa.

