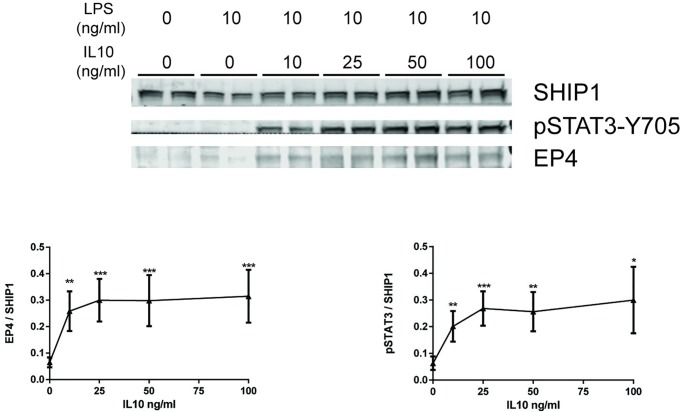
Fig 2. IL10 dose-dependent upregulation of EP4 protein.
RAW264.7 cells were stimulated with 10 ng/ml LPS with the indicated concentrations of IL10 for 1 hour prior to protein lysate collection. Expression levels of EP4 and pSTAT3 proteins were determined by immunoblotting. Data plotted represents EP4 and pSTAT3 band intensities normalized to SHIP1 protein levels. The significance of the comparison between LPS and LPS + IL10 treatments was calculated by Two-Way ANOVA with Tukey’s correction, **** p<0.0001, *** p<0.001, ** p<0.01, * p<0.05, ns = not significant. Data are representative of three independent experiments.

