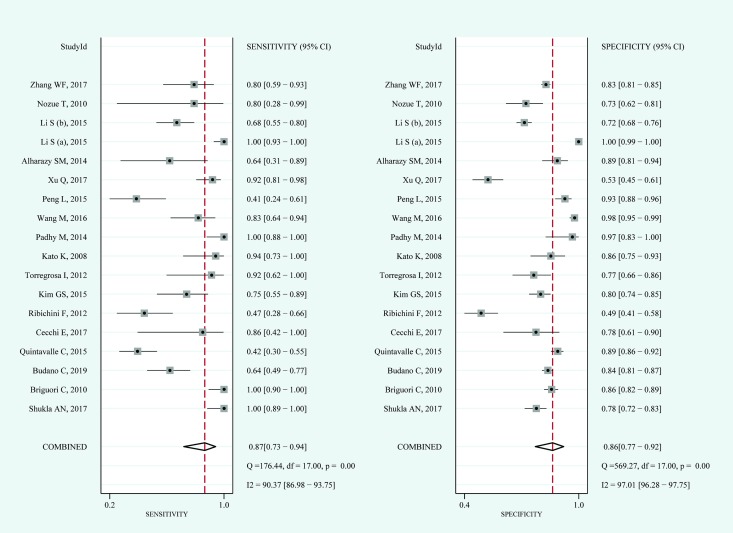
Fig 4. Coupled forest plots for the pooled sensitivity and specificity of serum cystatin C for the diagnosis of CIN.
Dots in squares represent sensitivity and specificity. Horizontal lines represent the 95% confidence interval (CI) for each included study. The pooled estimate is based on the random-effects model. Heterogeneities evaluation, I2 with 95% CIs and Q are provided. Q is Cochrane heterogeneity statistic and df is the degrees of freedom.

