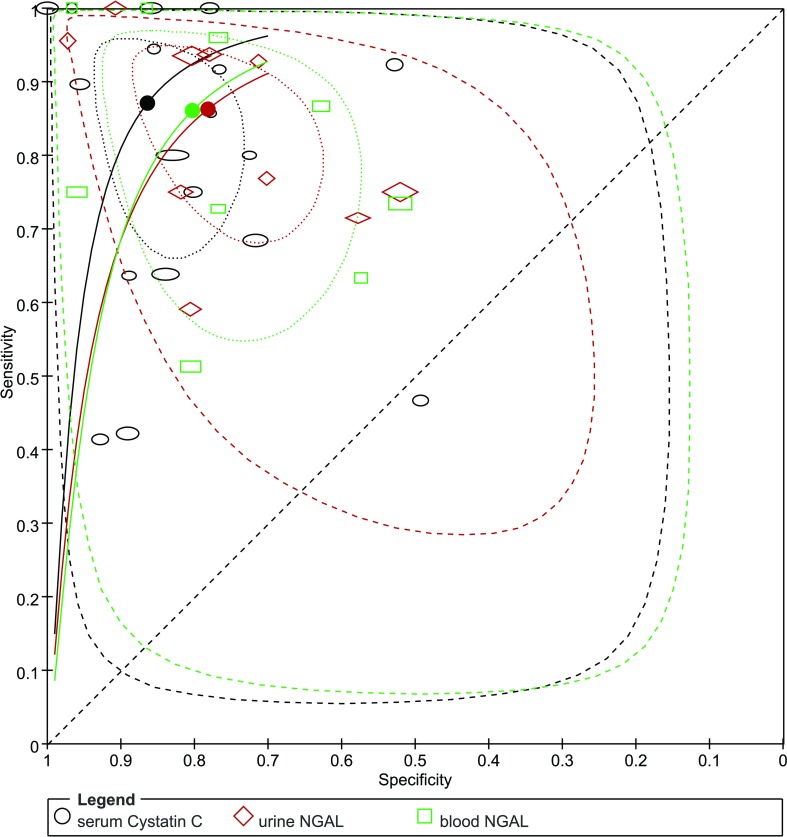
Fig 5. Hierarchical summary receiver operating characteristic (HSROC) curve for blood NGAL, urine NGAL and serum cystatin C for the diagnosis of CIN.
The black, green and red dots present the summary points for serum cystatin C, blood NGAL and urine NGAL respectively. The area circled by dot-dashed lines represent 95% confidence region; the area circled by dashed lines represent 95% prediction region.

