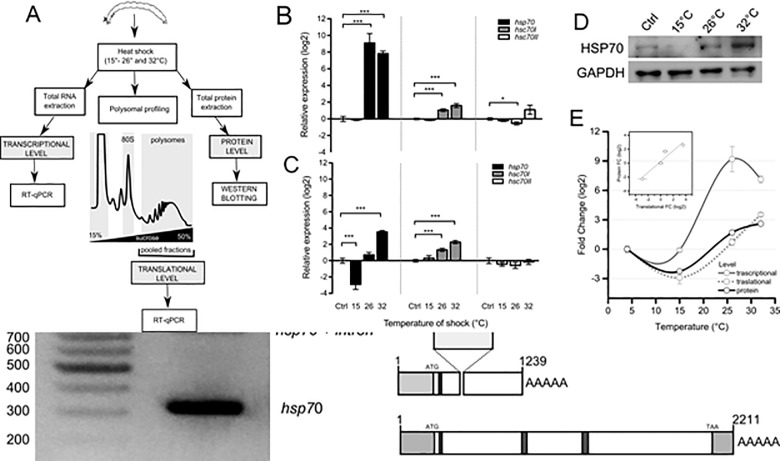
Fig 3. Multi-level analysis of gene expression of Dc-hsp70, hsc70-I and hsc70-II during thermal stress.
(A) Experimental design for comparing changes in gene expression at multiple levels. Insects were exposed to thermal stress. Total RNA was extracted to analyse the changes at transcriptional level. In parallel, changes associated with mRNA recruitment to polysomes was obtained by RNA extraction from polysomal fractions. These were collected after polysomal profiling to assess the translational changes in gene expression. Finally, whole proteins were extracted to assess protein level. In the first two cases, all three transcripts were studied. For the protein level, only Hsp70 was monitored. (B) Transcriptional expression level for hsp70, hsc70-I and hsc70-II. Total RNA was extracted from Diamesa tonsa larvae control (Ctrl, 4°C) or maintained for 1 h at 15, 26, and 32°C. hsp70, hsc70-I and hsc70-II relative expression levels were measured by real-time PCR. Actin was used as housekeeping gene and the level of control (Ctrl, 4°C) was set at 0. Error bars represent SE; n = 3 biological replicates and each assay was performed in triplicate. (C) Translational expression level for hsp70, hsc70-I and hsc70-II. Polysomal RNA was extracted from sucrose fractions corresponding to the polysomal peaks of larvae control (4°C) or maintained for 1 h at 15, 26, and 32°C. hsp70, hsc70-I and hsc70-II relative expression levels were measured by real-time PCR. Actin was used as housekeeping gene and the level of control (4°C) was set at 0. (D) Western blot analysis of HSP70 protein level in larvae control (Ctrl, 4°C) or maintained for 1 h at 15, 26, and 32°C. GAPDH was used as a loading control. (E) Comparison of the log2 Fold Change with respect to Ctrl of Transcriptional, Translational and Protein level after exposure to 15, 26 and 32°C. Asterisks indicate statistically significant differences with respect to control (Student t-test, * p ≤ 0.05, ** p ≤ 0.01, *** p ≤ 0.001). In the inset, the correlation between fold changes occurring at the translational and protein level was calculated (R2 = 0.922). In the case of transcriptional and translational comparison, the correlation was (R2 = 0.389), see S3A Fig.

