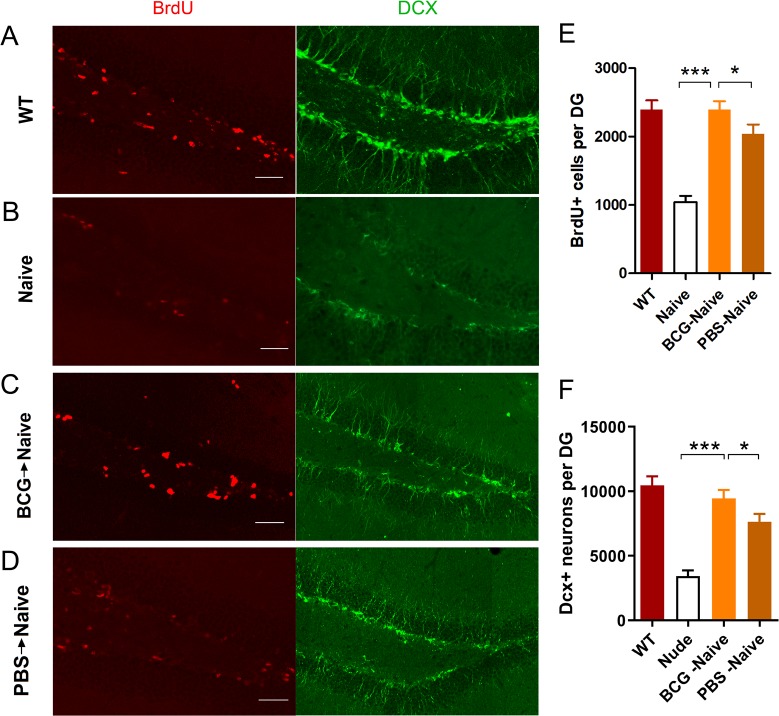
Fig 2.
The BCG->naive mice showed increased levels of hippocampal neurogenesis (A-F). Representative confocal micrographs of BrdU+-and Dcx+- labeled cells of the DG for each group of mice (A-D). Bars represent average values (mean ± SEM) for BrdU+- or Dcx+-labeled cells of each group (E-F). *p< 0.05; ***p< 0.001; n = 6/group. Scale bar: 50 μm in A-D.

