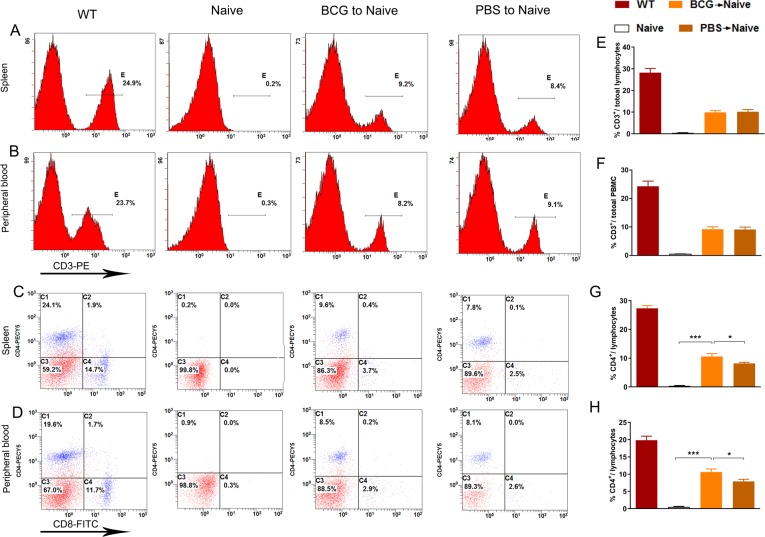
Fig 3.
The BCG->naive mice showed more CD4+ in spleen and peripheral blood (A-H). FACS: the proportion of CD3+ cells in spleen and peripheral blood for each group (A-B); the proportion of CD4+ and CD8+ cells in spleen and peripheral blood for each group (C-D); bars denote the proportion of CD3+ and CD4+to total lymphocytes found in the spleen and peripheral blood of each group (E-H). *p< 0.05, **p< 0.01; n = 6/group.

