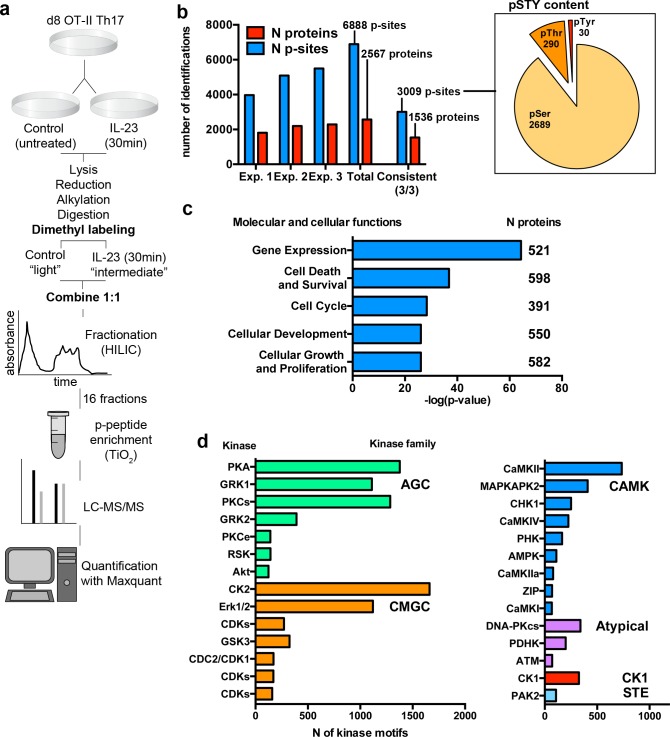
Fig 2. Global phosphoproteomic analysis of IL-23-stimulated OT-II/Th17 cells.
(a) Experimental workflow for global phosphoproteomic analysis. (b) Graph represents the number of unique p-sites and number of distinct proteins identified and quantified in the three individual biological replicates, the collective analysis (Total), and the p-sites and proteins consistently identified in the three biological replicates. Pie chart represents the number of Serine (pSer), Threonine (pThr), and Tyrosine (pTyr) among consistently identified p-sites. (c) Graph represents the statistical significance (-log(p-value)) of the top 5 molecular and cellular functions overrepresented within the Th17 phosphoproteome. Inset numbers indicate the number of proteins included in each group. (d) Graph represents the number of potential consensus sites for the indicated kinases present in the Th17 phosphoproteome. Multiple kinase assignment to single p-site was allowed. Kinases with at least 100 consensus sites are represented. Individual numerical values for quantifications presented in Fig 2 can be found in S2 Data. IL-23, Interleukin 23; p-site, phosphorylation site.

