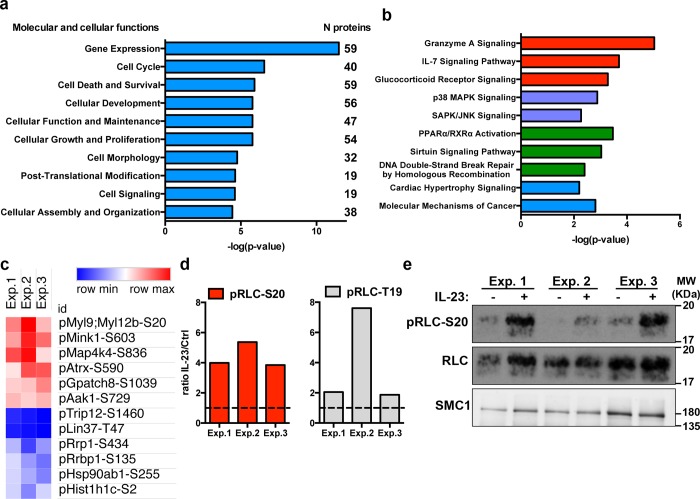
Fig 4. IL-23 regulated signaling pathways in the OT-II/Th17 phosphoproteome.
(a) Graph represents the statistical significance (-log(p-value)) of the top 10 molecular and cellular processes overrepresented among the IL-23-responsive phosphoproteins. Inset numbers indicate the number of proteins included in each group. (b) Graph represents the statistical significance (-log(p-value)) of the top 10 canonical signaling pathways overrepresented within the IL-23-responsive phosphoproteins. (c) Heatmap represents the ratio IL-23/Ctrl (linear value) for the top significantly up-regulated and down-regulated p-sites in the individual biological replicates. (d) Graphs show the ratio IL-23/Ctrl (linear value) for the indicated residues of the RLC in the three biological replicates. (e) Western blot analysis of RLC-S20 phosphorylation in the samples used for the phosphoproteomic analysis. SMC1 was used as the loading control. Individual numerical values for quantifications presented in Fig 4 can be found in S4 Data. Western blot raw images for Fig 4E can be found in S3 Raw images. Ctrl, untreated control; IL-23, Interleukin 23; RLC, myosin regulatory light chain; SMC1, structural maintenance of chromosomes 1A.

