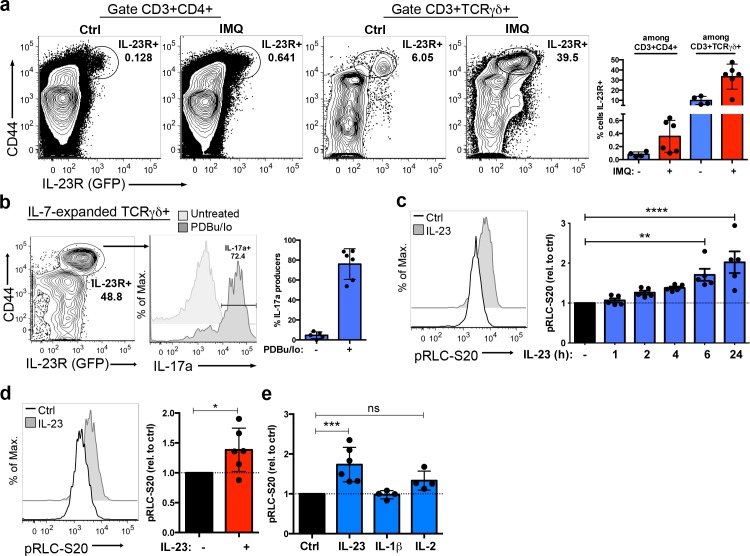
Fig 5. IL-23 induces RLC-S20 phosphorylation in TCRγδ IL-23R+ cells.
(a) Il23r-gfp reporter mice were treated with IMQ or left untreated (Ctrl) for 5 days. Lymph node cells were processed for analysis of IL-23R/GFP expression by flow cytometry. Representative contour plots show CD44 and IL-23R/GFP expression in the indicated subpopulations (CD3+CD4+ and CD3+TCRγδ+), and inset numbers represent the percentage of IL-23R+ cells within the indicated gates. Graph represents the percentage of cells expressing the IL-23R (mean ± sd, n = 4–6 mice). (b) TCRγδ cells were isolated from lymph nodes of Il23r-gfp reporter mice and cultured in presence of IL-7 for 5 days. Representative contour plot shows CD44 and IL-23R (GFP) expression in IL-7-expanded TCRγδ+ cells, and inset number represents the percentage of IL-23R+ cells in the indicated gate. IL-7-expanded TCRγδ cells were stimulated with PDBu/Io in presence of Golgi-Plug or left untreated for 4 h, and IL-17a production was determined by flow cytometry. Representative histograms show IL-17a production in Tγδ17 cells (gated as CD3+TCRγδ+CD44hi), and inset number represents the percentage of IL-17a+ cells. Graph shows the percentage of IL-17a-producers among Tγδ17 cells (mean ± sd, n = 5–6 independent cultures). (c) IL-7-expanded Tγδ17 cells were stimulated with IL-23 or left untreated (Ctrl) for different time points before measuring pRLC-S20 by flow cytometry. Representative histogram shows pRLC-S20 after 6 h of IL-23 stimulation. Graph shows the MFI of pRLC-S20 in response to IL-23 at the indicated time points, normalized to MFI of untreated cells (mean ± sd, n = 5 independent cell cultures, **p = 0.0037, ****p < 0.0001). (d) Total lymph node cells obtained from IMQ-sensitized mice were stimulated ex vivo with IL-23 for 18 h or left untreated (Ctrl) before assessing pRLC-S20 by flow cytometry. Representative histogram shows pRLC-S20 in Tγδ17 (gated as CD3+TCRγδ+CD44hi). Graph shows pRLC-S20 MFI in response to IL-23, normalized to untreated controls (mean ± sd, n = 6 mice, *p = 0.0487). (e) IL-7-expanded Tγδ17 cells were stimulated with IL-23, IL-1β, or IL-2 for 6 h, and pRLC-S20 was determined by flow cytometry. Graph shows pRLC-S20 MFI in Tγδ17 (gated as TCRγδ+CD44hi), normalized to untreated controls (mean ± sd, n = 4–6 independent cell cultures, ***p = 0.0006). Statistical analysis: (c, e) One-way ANOVA test with Dunnett´s correction for multiple comparisons. (d) One sample t test. Individual numerical values for quantifications presented in Fig 5 can be found in S5 Data. Ctrl, untreated control; GFP, green fluorescent protein; IL-23, Interleukin 23; IMQ, Imiquimod; MFI, mean of fluorescence intensity; PDBu/Io, Phorbol 12,13-dibutyrate/Ionomycin; pRLC-S20, phospho-RLC-Serine20; RLC, myosin regulatory light chain.

