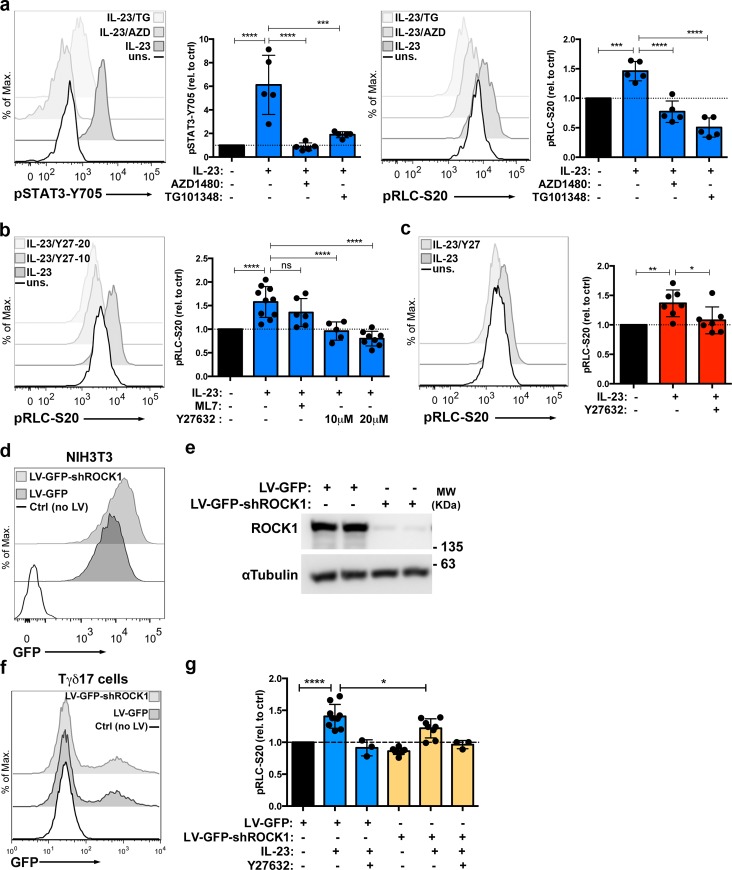
Fig 6. IL-23 induces pRLC-S20 through JAK2 and ROCK dependent mechanisms in Tγδ17 cells.
(a) IL-7-expanded Tγδ17 cells were stimulated with IL-23 in presence or absence of the indicated JAK2 inhibitors or left unstimulated (uns.) for 6 h before assessing pSTAT3-Y705 and pRLC-S20 by flow cytometry. Representative histograms show pSTAT3-Y705 (left) and pRLC-S20 (right) in the indicated conditions. Graphs show the MFI of pSTAT3-Y705 (***p = 0.0002, ****p < 0.0001) and pRLC-S20 (***p = 0.0004, ****p < 0.0001) in TCRγδ+CD44hi cells, normalized to unstimulated controls (mean ± sd, n = 5 independent cultures). (b) IL-7-expanded Tγδ17 cells were stimulated with IL-23 in presence or absence of ML7 (MLCK inhibitor) or Y27632 (ROCK inhibitor) or left untreated for 6 h, before measurement of pRLC-S20 by flow cytometry. Representative histograms show pRLC-S20 in the indicated conditions. Graph shows pRLC-S20 MFI in TCRγδ+CD44hi cells, normalized to unstimulated controls (mean ± sd, n = 5–10 independent cell cultures, ****p < 0.0001). (c) Lymph node cells obtained from IMQ-sensitized mice were stimulated ex vivo with IL-23 for 18 h in presence or absence of ROCK inhibitor Y27632 or left unstimulated. Representative histogram shows pRLC-S20 in Tγδ17 (gated as CD3+TCRγδ+CD44hi). Graph shows pRLC-S20 MFI in response to IL-23 (relative MFI, mean ± sd, n = 7 mice, *p = 0.017, **p = 0.0031). (d, e) NIH3T3 cells were transduced with lentiviral particles LV-GFP, LV-GFP-shROCK1, or not transduced (Ctrl), and 5 days later, processed for analysis by flow cytometry and western blot. (d) Representative histograms show GFP expression (n = 2 independent experiments). (e) Representative western blots of ROCK1 expression in transduced NIH3T3 α Tubulin was used as loading control (n = 2 independent experiments). (f, g) Tγδ17 cells were transduced with LV-GFP, LV-GFP-shROCK1, or not transduced (Ctrl) and 7 days later were analyzed by flow cytometry. (f) Representative histograms show GFP expression (n = 8 independent experiments). (g) Transduced Tγδ17 cells were stimulated with IL-23 in presence or absence of ROCK inhibitor Y27632 or left untreated for 18 h before assessing pRLC-S20 by flow cytometry. Graph shows pRLC-S20 MFI in Tγδ17 GFP+ cells, normalized to the untreated control (mean ± sd, n = 8, ****p < 0.0001, *p = 0.013). Statistical analysis by one way ANOVA with Dunnet correction for multiple comparisons. Individual numerical values for quantifications presented in Fig 6 can be found in S6 Data. Western blot raw images for Fig 6E can be found in S4 Raw images. Ctrl, untreated; IL-23, Interleukin 23; IMQ, Imiquimod; JAK2, Janus kinase 2; LV-GFP, lentiviral construct encoding a GFP reporter marker; LV-GFP-shROCK1, lentiviral construct encoding a GFP reporter marker and shRNAs against ROCK1; MFI, mean of fluorescence intensity; pRLC-S20, phospho-RLC-Serine20; ROCK, Rho-associated protein kinase.

