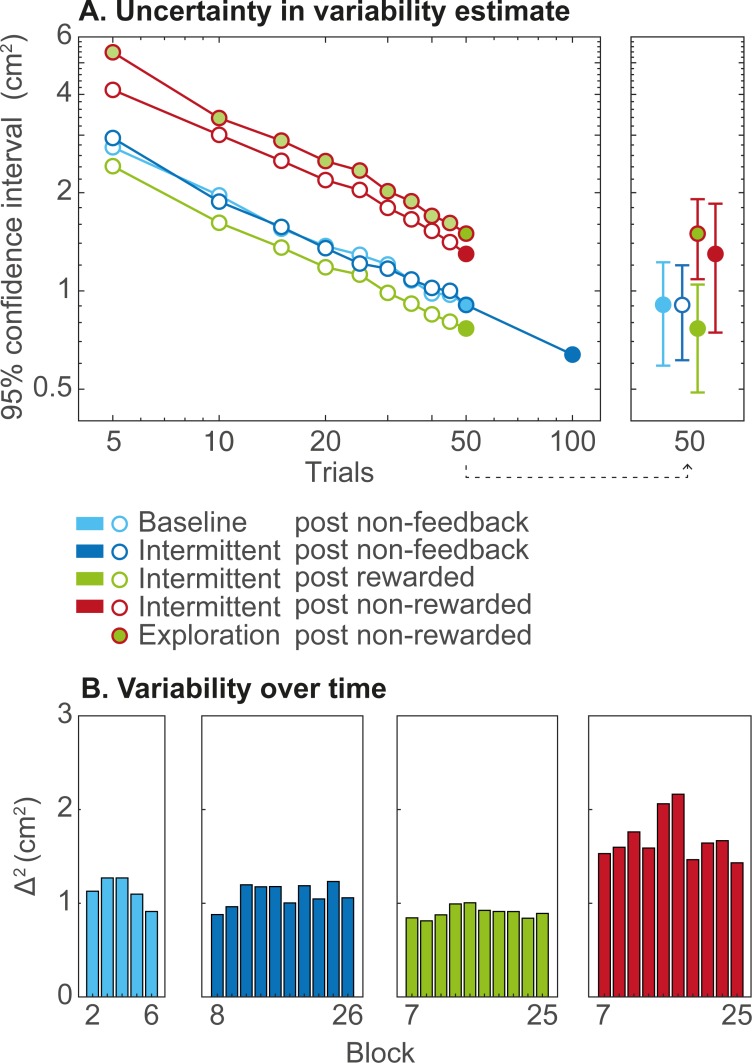
Fig 3. Uncertainty in the estimates of variability.
(A) Uncertainty of variability (Δ2) as a function of number of trials based on which it was estimated (log-log plot). Circles indicate the median across participants. Filled circles correspond to the variability and exploration as presented in Fig 2B and 2C. The right panel provides an indication of variations across participants of this uncertainty: the error bars indicate the interquartile range across participants. (B) Variability estimates (Δ2) per non-feedback block of 10 trials in the baseline phase and in the intermittent phase, and Δ2 estimates following rewarded and non-rewarded trials per feedback block in the intermittent phase. Bars indicate the median across participants.

