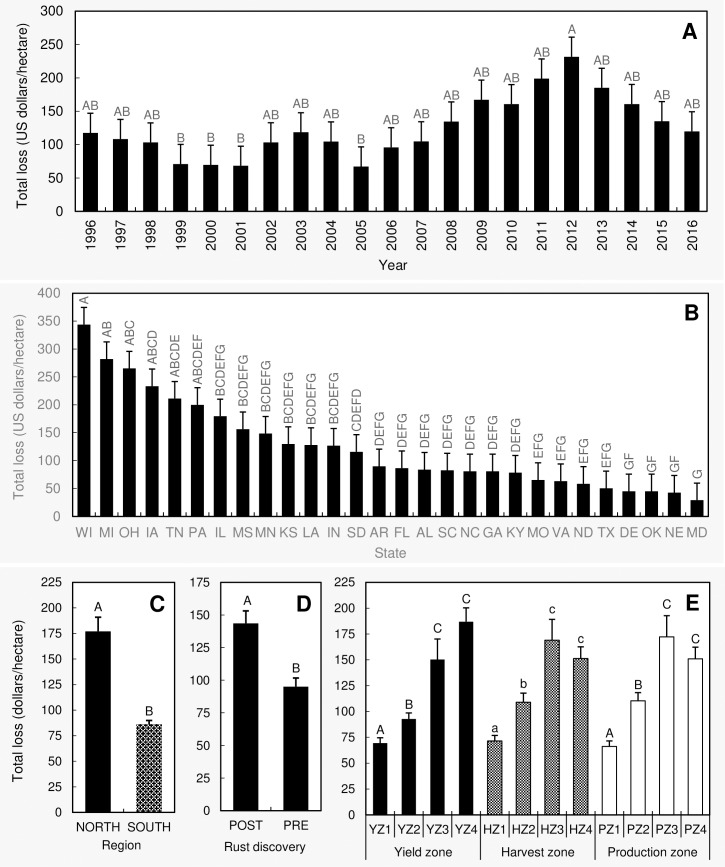
Fig 3.
Comparison of the mean total economic losses (within a state, during a given year) due to all 23 diseases considered for this paper among (A) years, (B) states, (C) regions, (D) pre- and post-discovery of soybean rust, and (E) yield/harvest/production zones. Treatment means with different letter designations (within each sub-figure) are significantly different at α = 0.05 based on the adjustment for multiple comparison using Tukey-Kramer test. Error bars represent standard errors. Diseases = Anthracnose, bacterial blight, brown stem rot, Cercospora leaf blight (purple seed stain), charcoal rot, Diaporthe-Phomopsis, downy mildew, frogeye leaf spot, Fusarium wilt, other diseases, Phytophthora root and stem rot, pod and stem blight, Rhizoctonia aerial blight, root-knot and other nematodes, Sclerotinia stem rot (white mold), seedling diseases, Septoria brown spot, soybean cyst nematode, soybean rust, southern blight, stem canker, sudden death syndrome, and virus diseases. Southern region = Alabama, Arkansas, Delaware, Florida, Georgia, Kentucky, Louisiana, Maryland, Mississippi, Missouri, North Carolina, Oklahoma, South Carolina, Tennessee, Texas, and Virginia; Northern region = Illinois, Indiana, Iowa, Kansas, Michigan, Minnesota, Nebraska, North Dakota, Ohio, Pennsylvania, South Dakota, and Wisconsin; Post-discovery of soybean rust = from 2004 to 2016; Pre-discovery of soybean rust = from 1996 to 2003; Yield/Harvest/Production zones = represent four levels (zone 1–4) based on the quartiles within a data base containing 588 yield (kg/ha)/harvest area (ha)/production (MT) data points (588 = 21 years × 28 states). Within this data base, data points from the minimum to the first quartile were classified as zone 1. Similarly, data points from the first quartile to median, median to the third quartile, and > third quartile were respectively classified as zones 2, 3, and 4.

