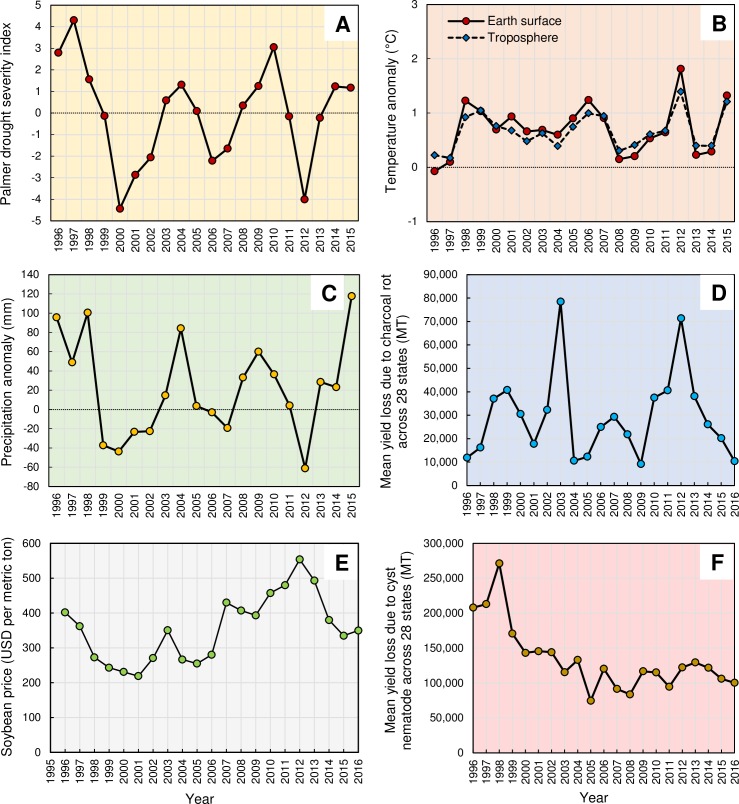
Fig 8.
(A) Annual values of the Palmer Drought Severity Index, averaged over the entire area of the contiguous 48 states. Positive values represent wetter-than-average conditions, while negative values represent drier-than-average conditions. A value between -2 and -3 indicates moderate drought, -3 to -4 is severe drought, and -4 or below indicates extreme drought. (B) Annual average temperature in the contiguous 48 states. (C) Total annual precipitation in the contiguous 48 states. Graph uses the 1901 to 2000 average as a baseline for depicting change. Selecting a different baseline period would not change the shape of the data over time. Data for figures were obtained from the National Oceanic and Atmospheric Administration’s National Centers for Environmental Information (www7.ncdc.noaa.gov.). (D) The annual soybean price fluctuation in the United States from 1996 t0 2016 (price for a given year is the mean value across 28 soybean growing states (AL, AR, DE, FL, GA, IA, IL, IN, KS, KY, LA, MD, MI, MN, MO, MS, NC, ND, NE, OH, OK, PA, SC, SD, TN, TX, VA, and WI). (E) Mean soybean yield loss due to charcoal rot disease across 28 states from 1996 to 2016. (F) Mean soybean yield loss due to soybean cyst nematode across 28 states from 1996 to 2016.

