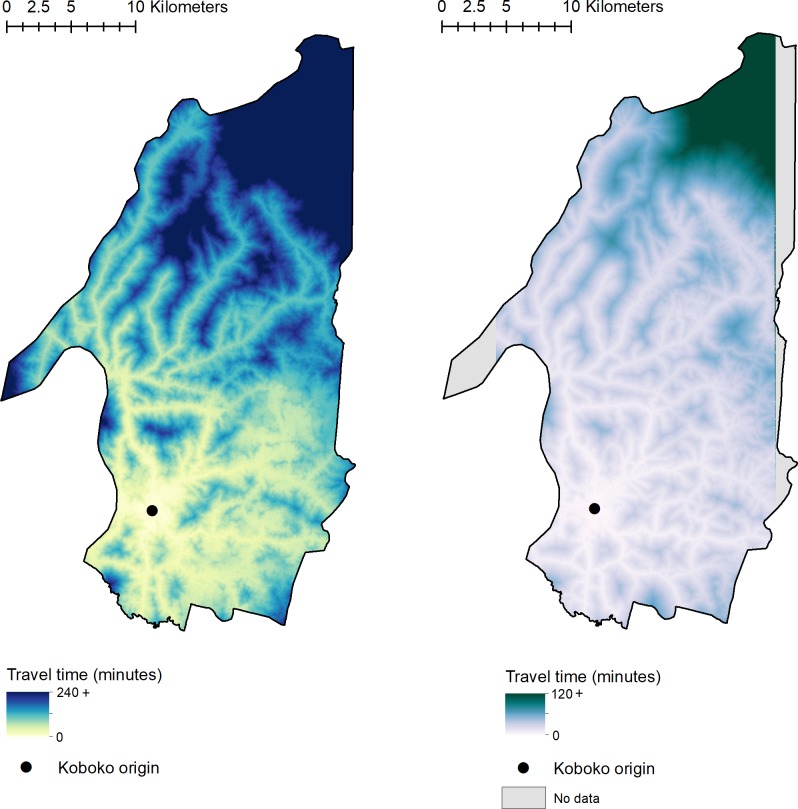
Fig 3. Cost-distance surfaces.
Figures show the cumulative travel time from the field site origin (black point), to each subsequent cell within the surface. Left: 3m cost-distance surface, Right: 0.5m cost-distance surface. This figure was generated using ArcGIS version 10.4 [42].

