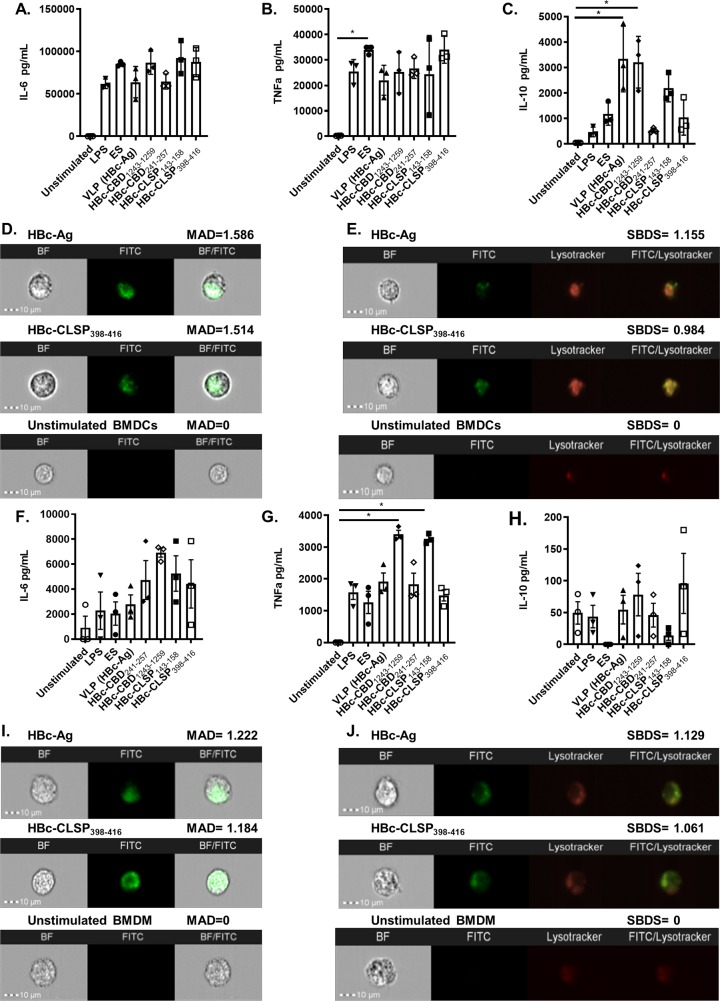
Fig 2. Inflammatory cytokine production by mouse bone marrow-derived DCs (BMDCs) and mouse bone marrow-derived macrophages (BMDMs) in response to VLPs.
(A-C) BMDCs and BMDMs (F-H) at 1X10⁶/ml were stimulated in vitro with 10 μg/ml VLPs (HBc-Ag, HBc-H112-128, HBc-CBD1243-1259, HBc-CBD241-257, HBc-CLSP143-158 and HBc-CLSP398-416) and with 50 μg/ml ES and 0.1 μg/ml LPS as positive controls. Unstimulated BMDCs and BMDMs served as negative controls. Supernatants were harvested after 24 hours for IL-6, TNF-α and IL-10 cytokine analyses measured by LEGENDplex or CBA. The bars represent mean ± SEM. Statistical analyses were carried out using the Kruskal-Wallis test (multiple comparisons). Significant differences between groups are represented by *(P≤0.05) with a line. Chart bars represent BMDCs and BMDMs grown from three individual mice from one representative experiment of two separate experiments. (D) Representative images of fluorescein-conjugated VLPs internalisation in the BMDCs and BMDMs (I). BMDCs and BMDMs at 1X10⁶/ml were incubated with 10 μg/ml fluorescein-conjugated VLP (HBc-Ag and HBc-CLSP398-416) for 24 hours. As a negative control, unstimulated BMDCs and BMDMs were examined. Cell internalisation was determined by Amnis ImageStreamX cytometer compared to unstimulated BMDCs and BMDMs. Images shown, from left to right, show individual Brightfield images (BF) in the white channel, fluorescent-labelled stimulus (FITC) in the green channel and the combination of both BF/FITC merged channels. The internalisation mean absolute deviation (MAD) is included above its images. The positive MAD value represents internalisation, and negative values represent poor internalisation. (E) Representative images of fluorescein-conjugated VLPs co-localization in the BMDCs and BMDMs (J). BMDCs and BMDMs at 1X10⁶/ml were stained with Lysotracker to visualise the cellular lysosome compartment and subsequently stimulated with 10 μg/ml fluorescein-conjugated VLP (HBc-Ag, and HBc-CLSP398-416) for 24 hours. As a negative control, unstimulated BMDCs and BMDMs were examined. Intracellular co-localization was determined by Amnis ImageStreamX cytometer. Images shown, from left to right, show individual Brightfield images (BF) in the white channel, fluorescent-labelled stimulus (FITC) in the green channel, stained lysosome (Lysotracker) in the red channel and the combination of both FITC/ Lysotracker merged channels. The Similarity bright detail score (SBDS) from the IDEAS quantitative co-localization analysis is included above its image. SBDS values around 1 represent co-localization, and 0 values represent poor co-localization. Scale bars represent 10 μm.

