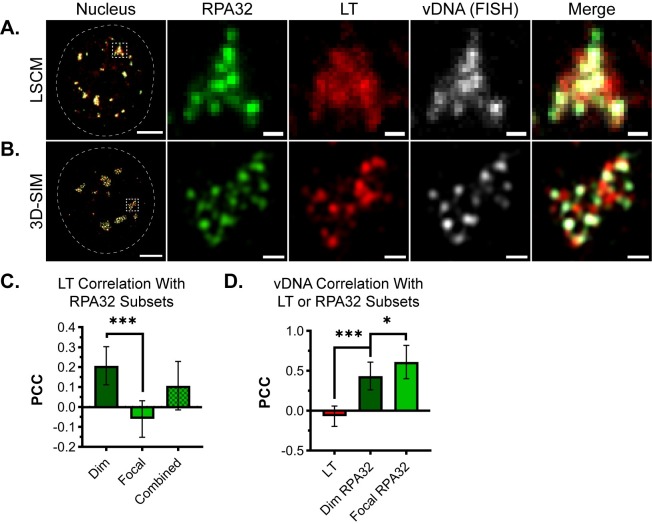
Fig 1. MuPyV replication centers are organized into subdomains.
MEFs were infected with WT MuPyV for 30 hrs then fixed and immuno-labeled. Dotted white lines outline the nuclear border, dotted white boxes delineate the cropped viral replication center (VRC) shown in panels to the right of each nucleus. Cells were probed for RPA32 (green), LT (red), and MuPyV DNA (FISH) (gray), then imaged by either (A) laser scanning confocal microscopy (LSCM) or (B) 3D structured illumination microscopy (3D-SIM). Scale Bars: Nucleus = 5μm, Crop = 0.5μm. (C) Pearson’s Correlation Coefficient (PCC) analysis of LT signal with each subset of RPA32 signal (dim, focal, or combined). (D) PCC analysis of vDNA signal with either LT, dim, or focal RPA32 signal. Paired t-tests were used to compare mean values (*** = p<0.001; * = p<0.05). n = 13 nuclei.

