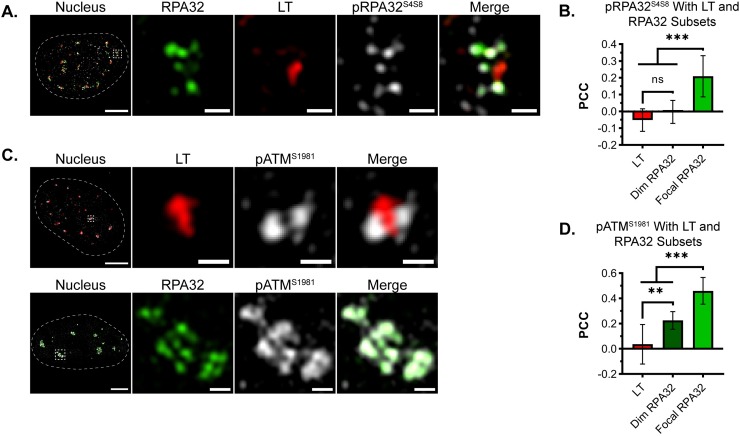
Fig 2. Focal RPA32 is associated with DDR signaling proteins.
MEFs were infected with WT MuPyV, processed for microscopy as described in Fig 1, then imaged by 3D-SIM. (A) Cells were stained for total RPA32 (green), LT (red), and pRPA32S4S8 (gray). pRPA32S4S8 associates preferentially with damaged DNA. (B) PCC analysis of pRPA32S4S8 with either LT, dim RPA32, or focal RPA32. n = 10 nuclei. (C) Cells were stained for pATMS1981 (gray) and either total RPA32 (green) or LT (red). Protein combinations were labeled and imaged separately due to incompatible antibody sources. (D) PCC analysis of pATMS1981 with either LT, dim RPA32, or focal RPA32. n = 12 nuclei. Single z-planes of representative nuclei are shown. Scale Bars: Nucleus = 5μm, Crop = 0.5μm. Paired t-tests were used to compare mean values (*** = p<0.001; ** = p<0.01; ns = p>0.05).

