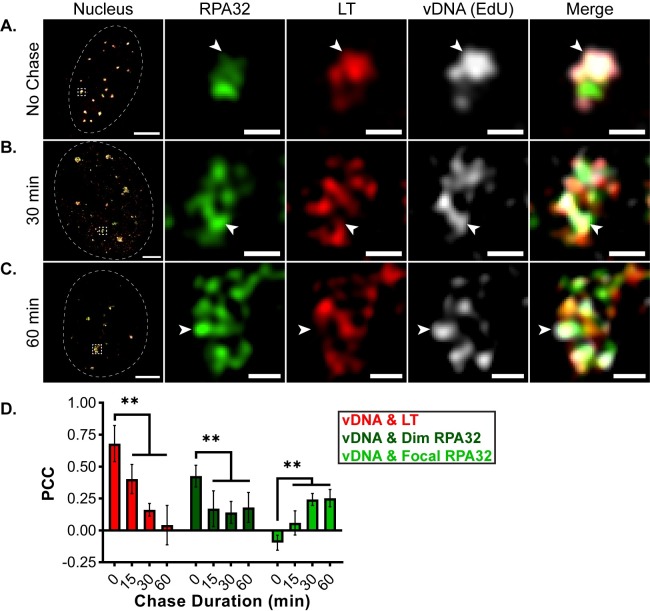
Fig 4. MuPyV DNA progresses from LT to focal RPA32 subdomains.
MEFs were infected with WT MuPyV and processed and labeled as described in Fig 3. Cells were stained for RPA32 (green), LT (red), and EdU-labeled vDNA (gray), then imaged by 3D-SIM. A single z-plane of representative nuclei from: (A) 0 min (no chase), (B) 30 min, and (C) and 60 min chase conditions. Arrowheads in each panel indicate regions of vDNA (EdU) localization relative to RPA32 and LT. Scale Bars: Nucleus = 5μm, Crop = 0.5μm. (D) PCC analysis of vDNA (EdU) with either LT, dim RPA32, or focal RPA32. Unpaired t-tests were used to compare mean values (** = p<0.01). n = 6 nuclei per time point.

