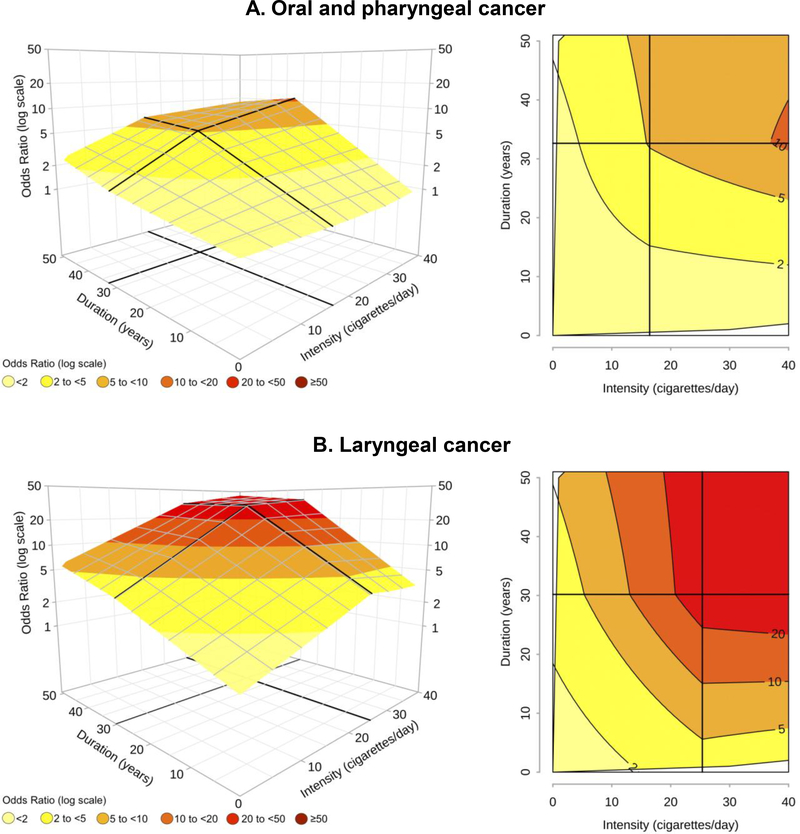
Figure 2 – Odds ratiosa,b of oral and pharyngeal cancer and laryngeal cancer in current smokers, for the joint effect of intensity (cigarettes/day) and duration (years) of cigarette smoking estimated through bivariate spline models. INHANCE consortium.
a Fitted models included adjustment for age, sex, race, study, education, drinking status, drinking intensity, and drinking duration. The reference category was defined as “Never smokers”. b On the grid, black thicker lines represent knot locations: 16 cigarettes/day and 33 years of duration for oral and pharyngeal cancer and 25 cigarettes/day and 30 years of duration for laryngeal cancer, respectively. Dark grey lines in contour plots indicate iso-risk curves at defined levels of risk.

