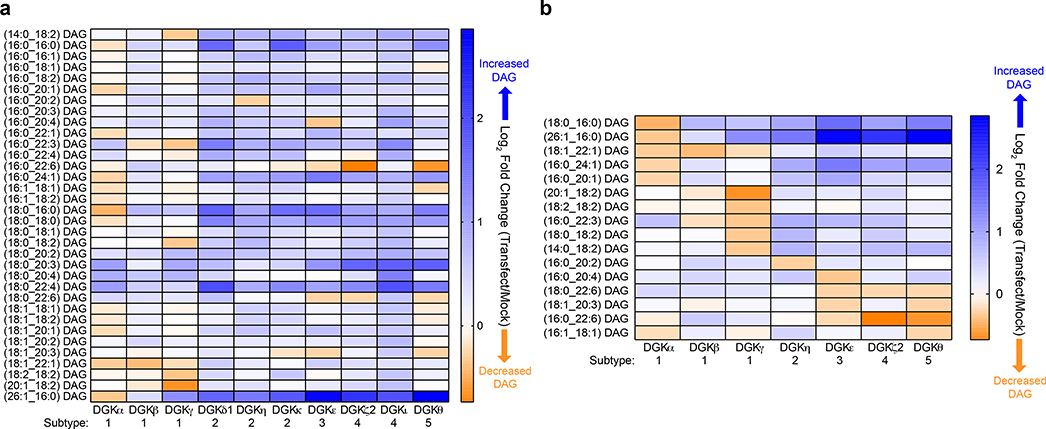
Figure 2. Assigning DAG substrate specificity to the DGK superfamily.
a) Heat map displaying live cell alterations in the DAG lipidome (log2 fold change) in recombinant human DGK overexpressed- compared with mock non-transfected-HEK293T cells (n=5 biological samples). All 10 isoforms from the DGK superfamily were analyzed by targeted lipidomics. b) Heat map highlighting altered DAGs that were unique and/or shared across DGK isoforms that showed at least a 15% change (log2 fold change of −0.23) in cellular lipid abundance (n=5 biological samples). Note that C18:0_C22:6 (DGKζ2) and C16:0_C22:6 (DGKε) DAGs showed changes at the set cutoff (~0.23). All data shown are representative of two experiments (n=2 biologically independent experiments).

