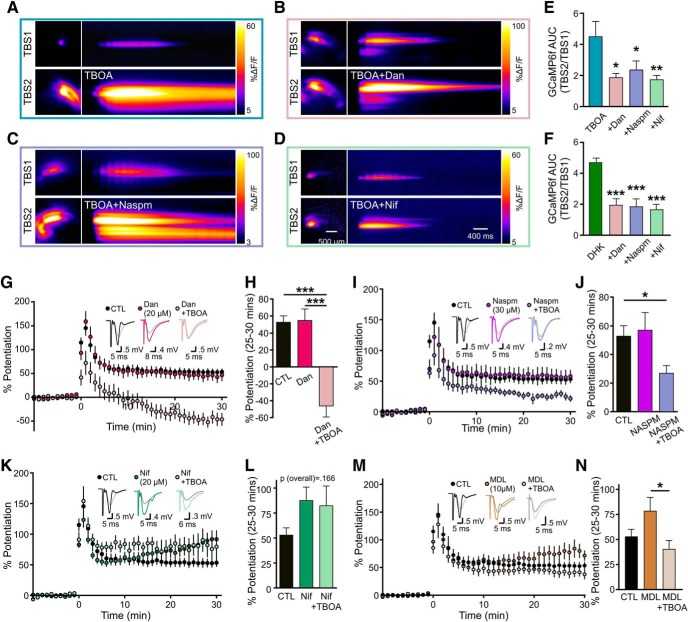
Figure 10.
Glutamate transporter inhibition impairs LTP by L-VGCC activation. A–D, Heat maps represent the maximal GCaMP6f response frame (left) and the GCaMP6f response profile over time (right) in response to TBS, both in control conditions (top images) and in the presence of 15 μm TBOA alone (A, bottom images) and in combination with dantrolene (Dan; 20 μm; B, bottom images), naspm (30 μm; C, bottom images), or nifedipine (Nif; 20 μm; D, bottom images). E, F, Grouped data show the fold increase in the GCaMP6f AUC in response to the second TBS (TBS2) compared with the first (TBS1). For all experiments, the first TBS was applied in control conditions and the second TBS was applied in the presence of 15 μm TBOA (E) or 100 μm DHK (F) alone or in combination with dantrolene, naspm, or nifedipine as indicated. G, H, LTP in control conditions and in the presence of the ryanodine receptor inhibitor, dantrolene, alone and in combination with 15 μm TBOA. Percent potentiation shown in H. I, J, LTP in control conditions and in the presence of the GluA2-lacking AMPAR blocker naspm alone and in combination with 15 μm TBOA. Percent potentiation shown in J. K, L, LTP in control conditions and in the presence of the L-VGCC blocker nifedipine alone and in combination with 15 μm TBOA. Percent potentiation shown in L. M, N, LTP in control conditions and in the presence of the calpain inhibitor MDL 28170 alone and in combination with 15 μm TBOA. MDL 28170 was applied 10 min after TBS. Percent potentiation shown in N. *p < 0.05; **p < 0.01; ***p < 0.001.

