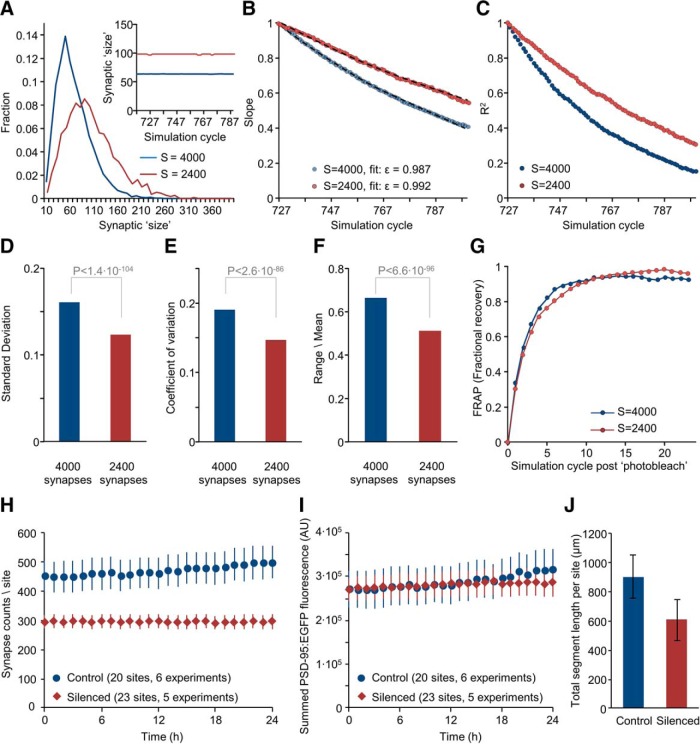
Figure 10.
Effects of silencing on synaptic counts and innate synaptic molecule dynamics. A, Simulated limiting distributions of synaptic sizes (4000 and 2400 synapses, last simulation step) using the same value of Ntotal (= 640,000). Inset, Mean synaptic size during last 72 simulation steps. B, Slopes of linear regression lines as in Figure 7D for the last 72 simulation steps for 4000 and 2400 simulated synapses; apparent <ϵ> values derived from these data are indicated. Fits using these values of <ϵ> are shown as black dashed lines. C, Coefficients of determination (R2) of linear regression fits as in Figure 7D for the last 72 simulation steps. D–F, Magnitude of synaptic size fluctuations in the simulated data for 4000 and 2400 simulated synapses. Averages of SDs, coefficients of variation and range/mean values calculated for all synapses over the last 24 simulation steps. Indicated p values are for t tests assuming unequal variances. G, Simulated FRAP curves for simulations of 4000 and 2400 synapses (200 photobleached synapses, 24 simulation time steps). H, Average (±SEM) PSD-95:EGFP puncta counts per field-of-view (site) measured in silenced and control networks over 24 h periods (same dataset as in Fig. 2). I, Average (±SEM) of summed PSD-95:EGFP puncta fluorescence in each field-of-view in silenced and control networks. J, Total dendritic segment length per field-of-view (μm, average ± SD) in silenced and control networks (20 and 20 fields-of-view, respectively).

