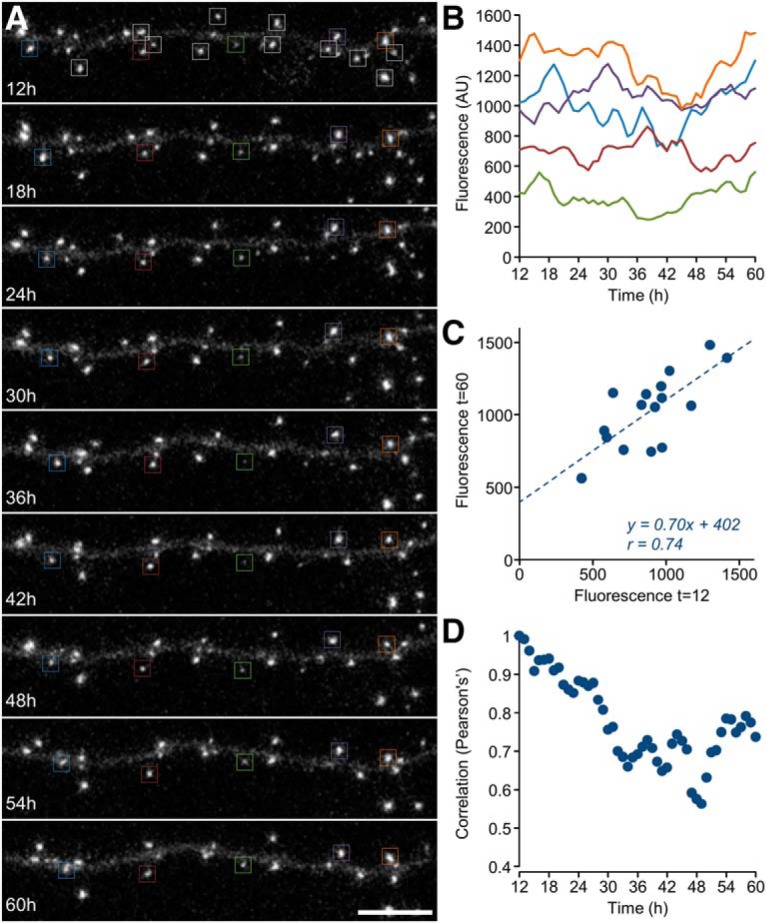
Figure 3.

Synaptic size fluctuations in chronically silenced networks. A, A dendritic segment of a neuron in a chronically silenced network (20 d in culture) expressing PSD-95:EGFP followed for 60 h at 1 h intervals (only a subset of images is shown). Sixtenn synapses (top, rectangles) were tracked for 48 h and their fluorescence measured. Synapses not enclosed in rectangles are synapses whose tracking was ambiguous and were therefore excluded. A subset of tracked synapses is marked with color coded rectangles in all eight panels. Time t = 0 represents the beginning of the imaging session. Scale bar, 10 μm. B, Forty-eight hour trajectories of the fluorescence of the color-coded synapses in A. C, A comparison of fluorescence values for the 16 synapses shown in A at t = 12 and t = 60. The dashed line is a linear regression fit. Fit parameters and Pearson's correlation coefficient are indicated. D, Pearson's correlation coefficients in plots such as C for all 48 time points.
