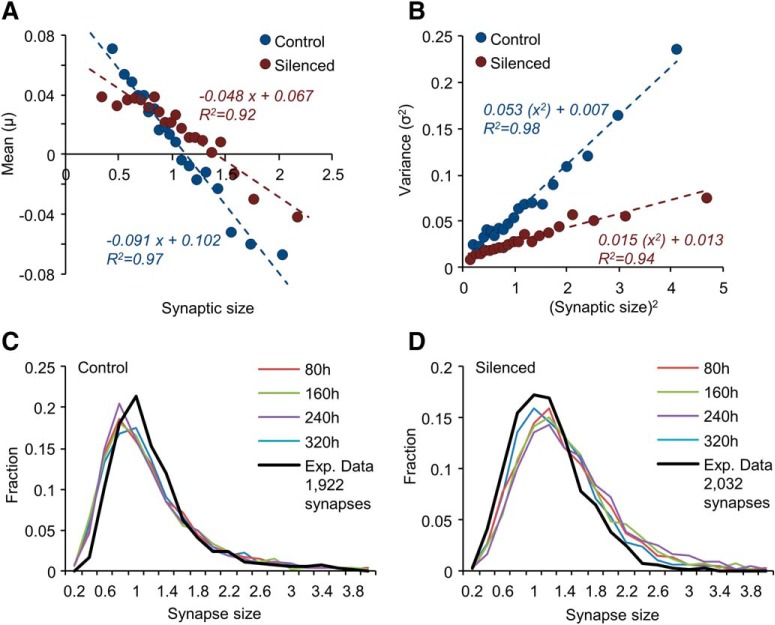
Figure 6.
Simulating synaptic size dynamics as a nonlinear Langevin process. A, B, Statistics of synaptic size change. Means (μ; A), and variances (σ2; B) of size changes as functions of initial synaptic size (normalized). Data obtained from synapses tracked for 24 h. Each data point represents the average (A) or the variance (B) of size changes in a group of changes measured at 8 h intervals, binned by initial size (20 groups, 1764 and 1852 size change measurements in each group, control and silenced networks, respectively). The horizontal position of each dot represents the average initial size (A) or the square of this value (B) within the group. Dashed lines are linear regression fits to the data points; fit parameters are shown near each regression line. C, D, Evolution of synaptic sizes. Sizes of 1922 synapses (C; Control) and 2032 (D; Silenced) synapses were initialized using the experimental data of Figure 4F (t = 24) and evolved as a discrete nonlinear Langevin process as described in the main text and in Materials and Methods, using the parameters derived from A and B. Size distributions at 80 h intervals (10 simulation steps) are shown as color coded plots. Black lines are experimentally measured distributions. The small differences from experimentally measured distributions mainly result from the slight mismatch between estimates of <ϵ −1> and <η>, that should be identical in stationary distributions. This might reflect estimation errors or indicate that distributions were not yet fully stationary (as predicted by Fig. 5K,L, in particular for silenced networks).

