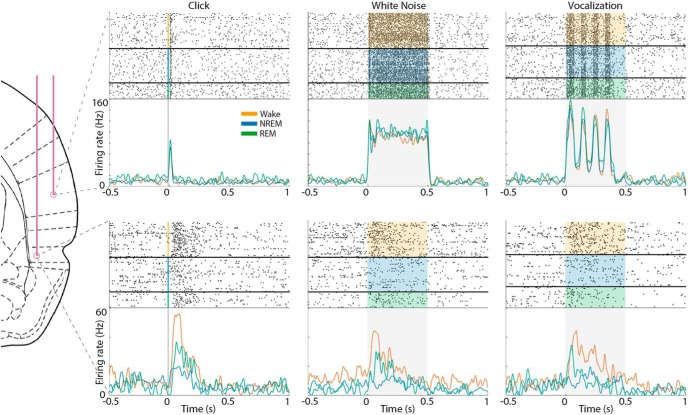
Figure 4.
Example auditory responses in AC and PRC neurons across wakefulness and sleep. Raster plots (top panels) and PSTH (bottom panels) show representative auditory responses in an AC neuron (top row) and a PRC neuron (bottom row) recorded simultaneously. Columns show responses to different stimuli, including a click (left), 12 kHz white noise burst (middle), and 66 kHz ultrasonic vocalization (right). In each panel, shaded area represents stimulus duration. Raster plots are grouped by vigilance state: orange represents wake; blue represents NREM sleep; green represents REM sleep. PSTH traces of different vigilance states are superimposed (colors as above).

