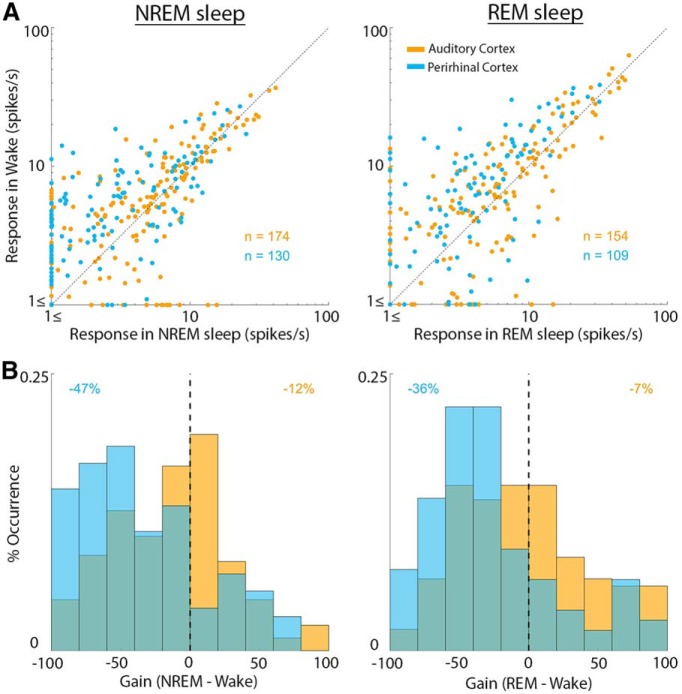
Figure 5.
Quantitative comparison of auditory responses in AC and PRC neurons across wakefulness and sleep. A, Scatter plot of response magnitude in wakefulness (y axis) versus NREM sleep (x axis, left column) or versus REM sleep (x axis, right column). Each dot represents one unit and its average response magnitude across all effective stimuli (see Materials and Methods). AC neurons (orange dots) distribute around the identity line. PRC neurons (blue dots) are mostly above the diagonal (stronger responses in wakefulness). B, Distribution of gain factors (see Materials and Methods) for AC neurons versus PRC neurons. Colors are as in A. Vertical dashed line indicates zero gain. Numbers in top corners indicate the median gain factor in each neuronal population.

