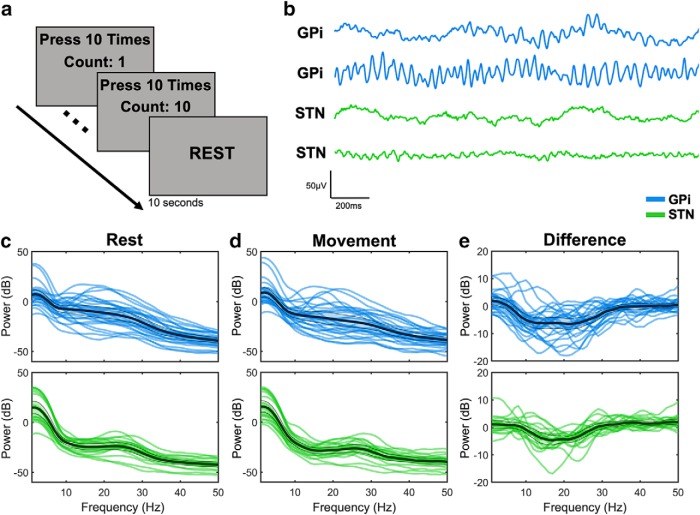
Figure 1.
Variability in beta power. a, Participants completed a simple task in which they pressed a button 10 times with the thumb contralateral to the implanted hemisphere while either GPi (blue) or STN (green) recordings were obtained. b, Two representative filtered bipolar traces during rest are shown for each target. Power from 1 to 50 Hz was extracted during rest (c) and during movement (d) to examine differences in beta power across targets, as well as their difference (movement minus rest) (e). In each case, thick black lines indicate the group-level mean. Shaded region within the thinner black lines represents 2 SEs above and below the mean. 0 dB is equivalent to 1 μV, 20 dB is equivalent to 10 μV, −20 dB is equivalent to 0.1 μV, and so on.

