Figure 3.
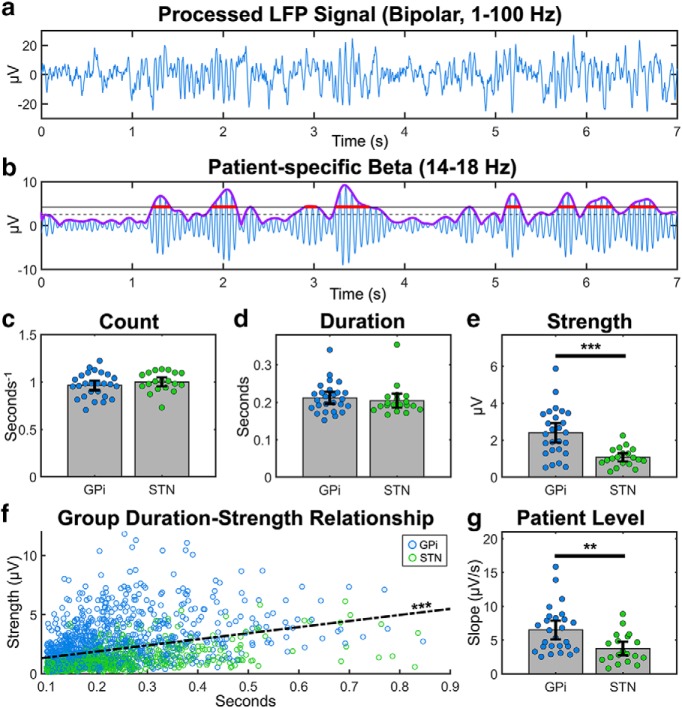
Beta burst properties in the GPi and STN. Bursts were computed using the 75th percentile threshold approach (see Materials and Methods). Blue represents data from GPi participants. Green represents data from STN participants. a, b, Example of a GPi bipolar recording filtered from 1 to 100 Hz and subsequently band passed between 14 and 18 Hz, centered at 16 Hz, the beta frequency for this participant with the most beta power desynchronization during movement. The purple line indicates the Hilbert transform of the beta-filtered signal. Dashed and solid black lines indicate the 50th and 75th percentile of the Hilbert transform, respectively. Red lines indicate the identified bursts. The average (c) number per second, (d) duration, and (e) strength of bursts for each participant. f, The relationship between duration and strength across all participants' bursts. g, The slope of the fitted line relating the duration and strength of beta bursts at the individual level. Error bars indicate two SEs above and below the mean (c–e, g). **p < 0.01, ***p < 0.001.

