. 2020 Mar 24;9:e52629. doi: 10.7554/eLife.52629

Figure 3. PHP.eB-mediated iMecp2 gene transfer in symptomatic Mecp2-/y mouse brains.

(a) Illustration of the experimental setting to restore the expression of Mecp2 in symptomatic mutant animals by AAV-PHP.eB systemic transduction. (b) Low magnification of Mecp2 immunostaining in brains of KO control untreated (UT) and treated animals (1×10¹⁰, 1×10¹¹, 1×10¹² vg/mouse). (c) High magnification immunostaining for Mecp2 and V5 in cortex and striatum derived from wild-type (WT) and Mecp2 treated KO (1×10⁹, 1×10¹⁰, 1×10¹¹, 1×10¹² vg/mouse) animals (Mecp2-KO). Nuclei were stained with DAPI (merge panels). Bottom panel: bar graphs showing the fraction of Mecp2 positive on the total DAPI positive (n = 4 for 1×10⁹–1×10¹⁰–1×10¹²; n = 8 1×10¹¹ vg/mouse). (d) Western blot analysis to quantify Mecp2 over Actin protein levels in cortex (upper panel) and striatum (lower panel) derived from WT, untreated KO and iMecp2 treated KO (1×10⁹, 1×10¹⁰, 1×10¹¹, 1×10¹² vg/mouse) animals and corresponding densitometric quantification expressed in arbitrary units (n = 4 for 1×10⁹–1×10¹⁰–1×10¹²; n = 5 1×10¹¹ vg/mouse). Error bars, SD. *p<0.05, **p<0.01 and ***p<0.001 as compared to WT mice (ANOVA-one way with Tukey’s post hoc test). Scale bars: 500 µm (b), 20 µm (c).
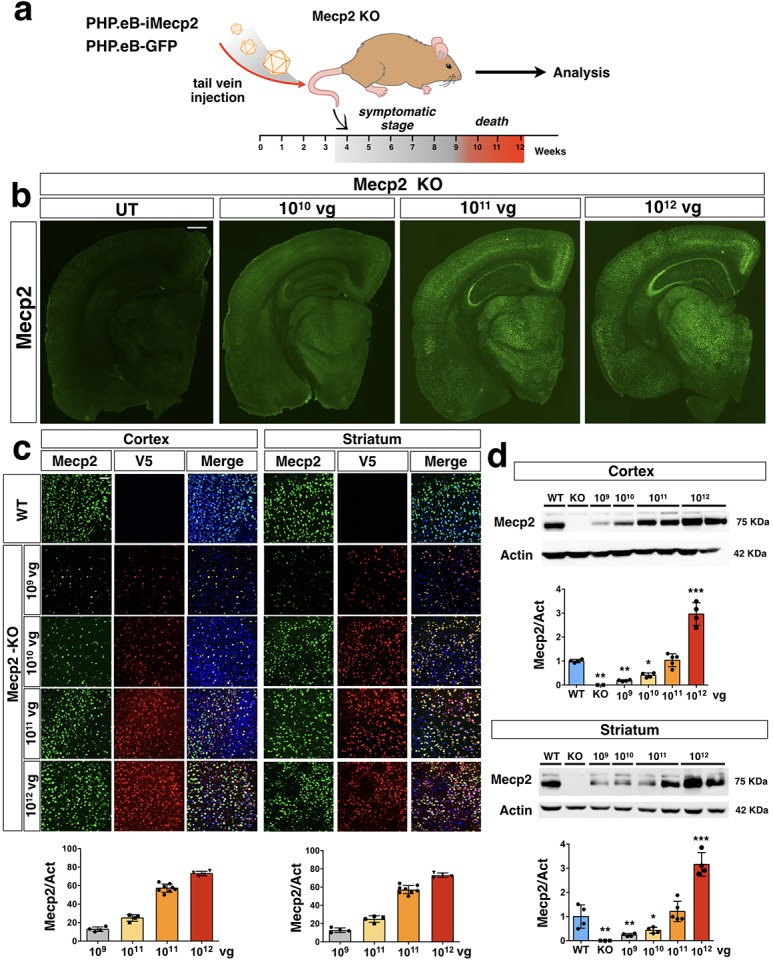
Figure 3.

Figure 3—figure supplement 1. Distribution and quantification of iMecp2 gene transfer in Mecp2-/y brains.
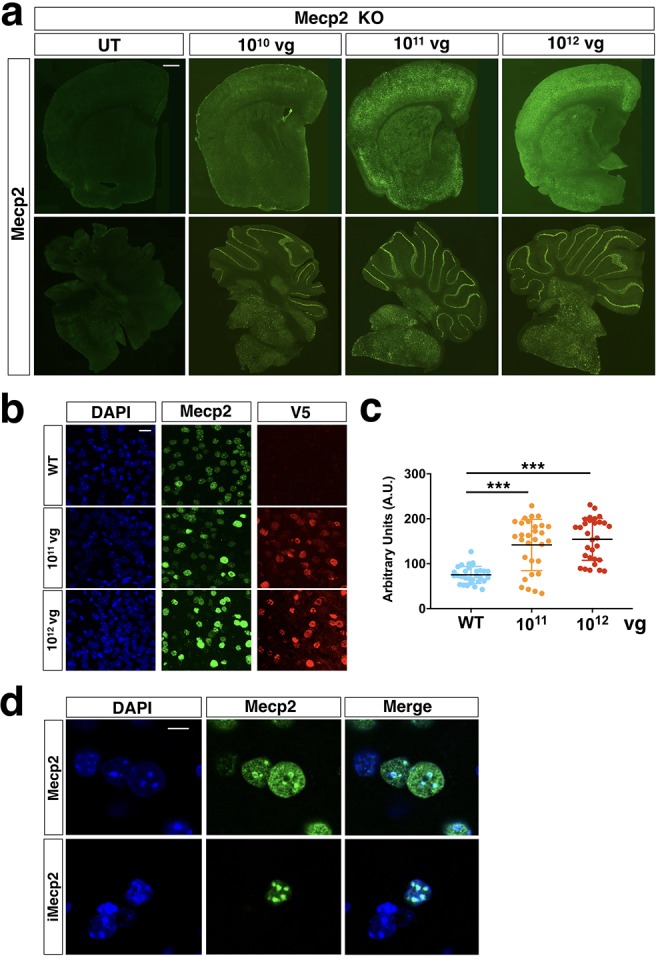
Figure 3—figure supplement 1.

(a) Low magnification of Mecp2 immunostaining of forebrain (upper panel) and cerebellum (lower panel) sections in KO control untreated (UT) and treated animals (1×10¹⁰, 1×10¹¹, 1×10¹² vg/mouse). (b) High magnification confocal images for Mecp2 and V5 in cortex derived from WT and iMecp2 treated KO (untreated [WT], 1×10¹¹ and 1×10¹² vg/mouse) animals. Nuclei were stained with DAPI. Scale bar: 10 μm. (c) graphs showing the quantification of cellular levels of total Mecp2 detected with anti-MeCP2 immunofluorescence in cells of the cortex and quantified in arbitrary units based on field pixel intensity (n = 30 nuclei for per condition, UN: untransduced). (d) High magnification confocal images of wild-type (WT, upper panel) and iMecp2 transduced nuclei (lower panel) stained with MeCP2 antibody both exhibit heterochromatin-enriched localization. Error bars, SD. ***p<0.001 as compared to untreated (WT) (ANOVA-one way, Tukey’s post hoc test). Scale bars: 500 µm (a), 10 µm (b), 5 µm (d).
Figure 3—figure supplement 2. Analysis of transduced neurons after iMecp2 gene transfer in Mecp2-/y brains.
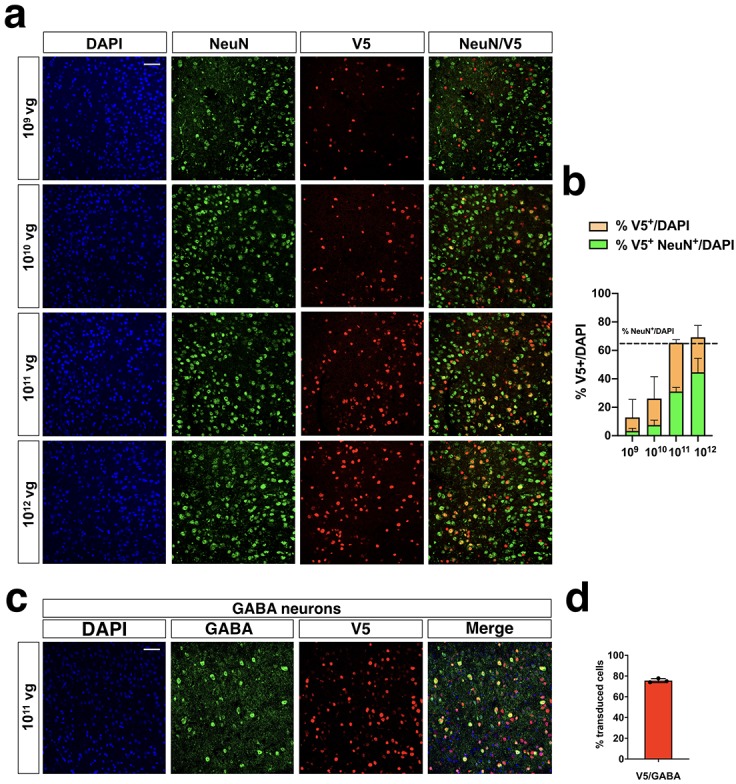
Figure 3—figure supplement 2.

(a) Characterization of iMecp2-transduced cells in KO cortex (1×10⁹, 1×10¹⁰, 1×1011,1×1012 vg/mouse) using colocalization of V5+ cells with a neuronal marker (NeuN). (b) Quantification of V5+ cells on total DAPI+ cells (orange bar) and V5+/NeuN+ cells on total DAPI+ cells (green bar). Dashed line indicates the number of NeuN+ cells on total DAPI+ cells. (c–d) Colocalization and quantification of transduced (V5+) GABAerigic interneurons (marked with GABA, GABA+) in iMecp2-transduced KO cortexes of animals treated with a 1×10¹¹ vg/mouse dose. Nuclei were stained with DAPI. All images were captured using confocal microscope. Scale bar: 50 μm. n = 3 animals per group.
Figure 3—figure supplement 3. Analysis of transduced astrocytes after iMecp2 gene transfer in Mecp2-/y brains.
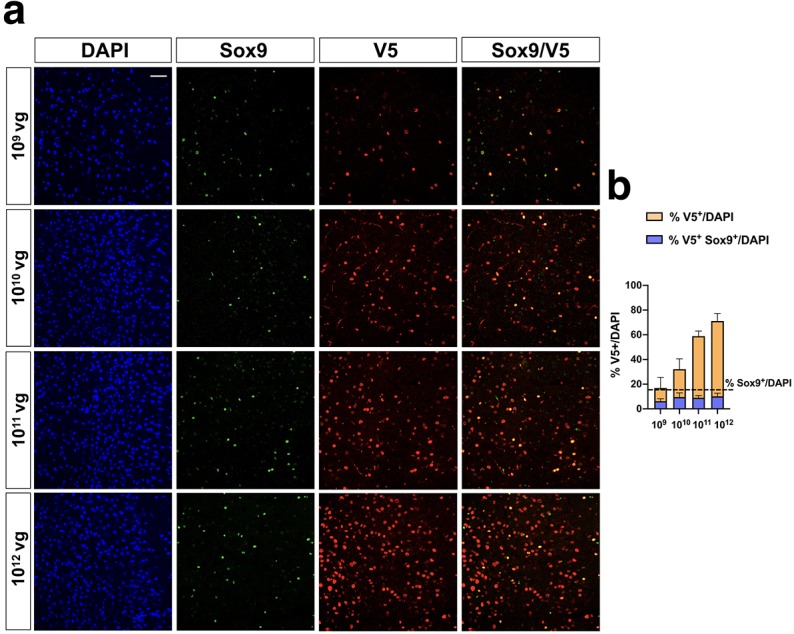
Figure 3—figure supplement 3.

(a) Characterization of iMecp2-transduced cells in KO cortex (1×10⁹, 1×10¹⁰, 1×1011,1×1012 vg/mouse) using colocalization of V5+ cells with an astrocytic marker (Sox9). (b) Quantification of V5+ cells on total DAPI+ cells (orange bar) and V5+/Sox9+ cells on total DAPI+ cells (blue bar). Dashed line indicates the number of Sox9+ cells on total DAPI+ cells. Nuclei were stained with DAPI. All images were captured using confocal microscope. Scale bar: 50 μm. n = 3 animals per group.
Figure 3—figure supplement 4. Characterization of iMecp2 transgene expression in brain and liver of Mecp2-/y animals.
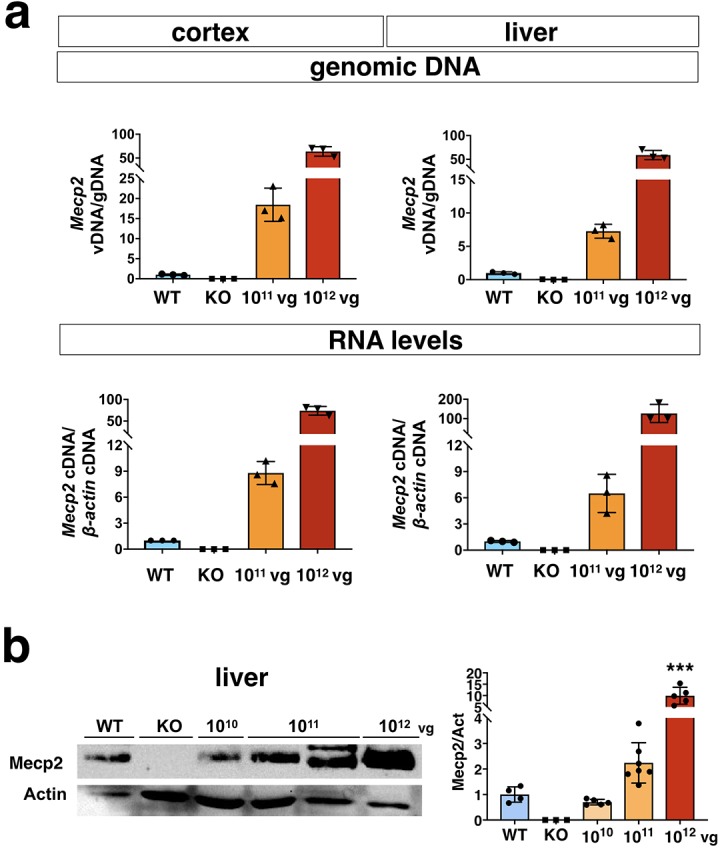
Figure 3—figure supplement 4.

(a) Vector biodistribution (upper panel) and transgene expression (lower panel) in mice cortex and liver of KO mice untreated (KO, n = 3) and treated with 1×10¹¹ (n = 3) or 1×10¹² (n = 3) iMecp2. Data were normalized over Mecp2 gene levels and expression of wild-type mice (WT, light blue bar), respectively. (b) Western blot analysis to quantify Mecp2 over Actin protein levels in liver (left panel) from WT, untreated and iMecp2 treated (1×10¹⁰, 1×10¹¹, 1×10¹² vg/mouse) KO animals and corresponding densitometric quantification expressed in arbitrary units (n = 5 for 1×10¹⁰, n = 7 for 1×10¹¹; n = 5 for 1×10¹² vg/mouse). Error bars, SD. ***p<0.001 as compared wild-type (WT) (ANOVA-one way, Tukey’s post hoc test).