
Figure 5. Behavioral rescue of symptomatic Mecp2-/y animals after PHP.eB-iMecp2 treatment in combination with cyclosporine.
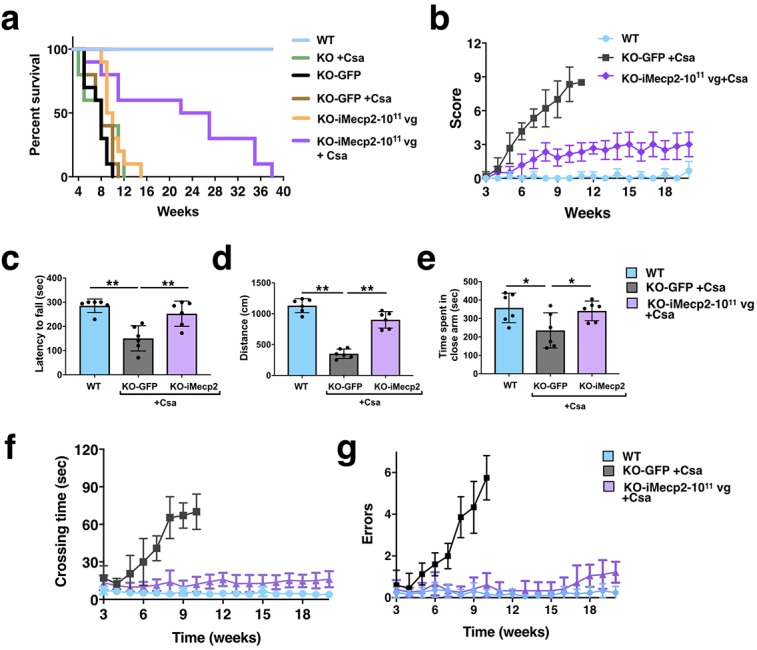
(a) Survival curve of KO mice Cyclosporine (CsA) treated (n = 5, green line) and GFP-treated alone (n = 10, black line) or in combination with cyclosporine (CsA) (n = 6, brown line) or injected with a 1×10¹¹ dose of PHP.eB-iMecp2 alone (n = 10, orange line) or in combination with cyclosporine (CsA) (n = 10, violet line). As control, WT littermates were used (n = 12, blue line). (b) General phenotypic assessment evaluated through the aggregate severity score (p<0.05 versus KO-GFP + Csa in 1×10¹¹ + Csa [5th-11th wk]). (c–e) Evaluation of the latency to fall from the Rotarod analysis (c), the distance of the spontaneous locomotor activity in a field arena (d) and the time spent in close arm in the elevated plus maze (e) 5 weeks after treatment and control mice (**p<0.01 and ***p<0.001 as compared to WT mice and KO-iMecp2 + Csa; n = 6 mice per groups). (f–g) Evaluation of motor coordination through beam balance test quantified as crossing time (f, p<0.05 versus KO-GFP + Csa in 1×10¹¹ + Csa [6th-10th wk]) and number of errors (g, p<0.05 versus KO-GFP + Csa in 1×10¹¹ + Csa [7th-10th wk]). Error bars, SD. ANOVA-two way (b, f, g) or ANOVA-one way (c, d, e) with Tukey’s post hoc test.